Introduction
Introduction to Reports
Reports are one of the "Common Features", these are the set of features that exist in every module and are used exactly the same way no matter in which module you are.
Reports allow you to visualize data in a graphical format by combining tables, charts, filters and text into a single report.
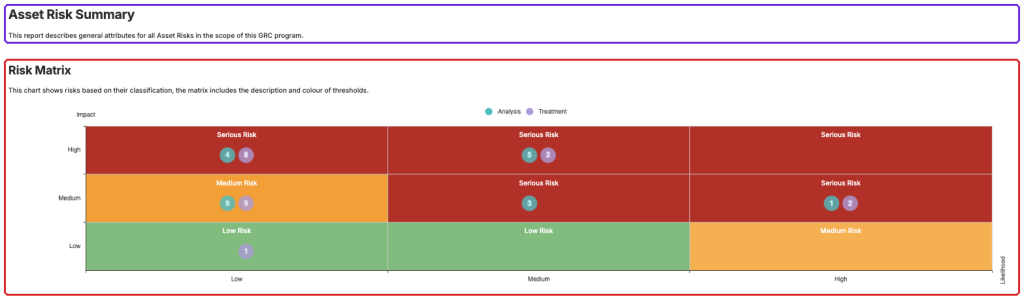
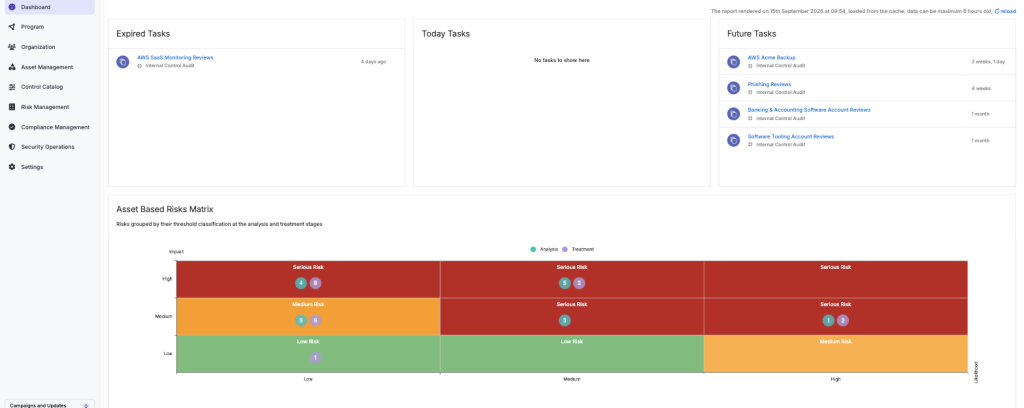
Reports are available in every module, there is a special report on the landing page when users log in to eramba we call the "Landing Dashboard". This dashboard is also a recollection of tables, graphs, text, Etc.
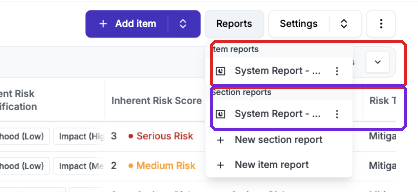
There are two types of reports on every module:
- Section: provide a summary of the module by taking as data source all items in that module. For example, if you are at the Risk module eramba will take data from every risk on the module to populate the report.
- Item: provide a summary of a specific item within a module. For example, you would like to see a report of a specific Risk rather than a summery of all risks together.
Both types of reports are user-defined templates, which as mentioned before, put together your choice of Text Fields, Tables, Filters and Graphical Charts. You can have as many templates as you wish.
The report builder allows you to drag and drop widgets, re-order them in any way you want around the report and to some extent customize how they look.
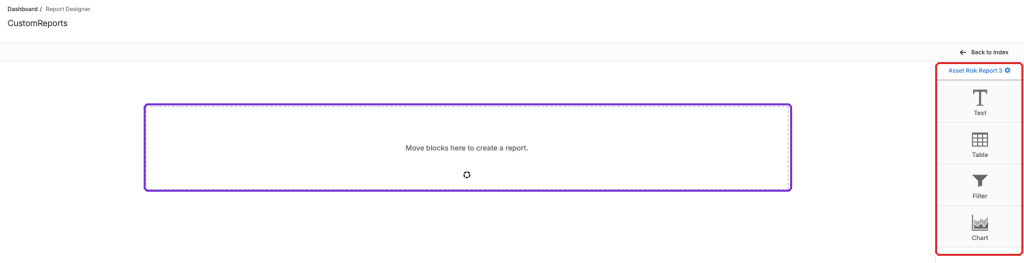
Once you build your report template you will be able to run it against a module (Section report) or a specific item (Item Report). eramba will simply fill in the data into your template and display the report to you. You can download reports in PDF format.
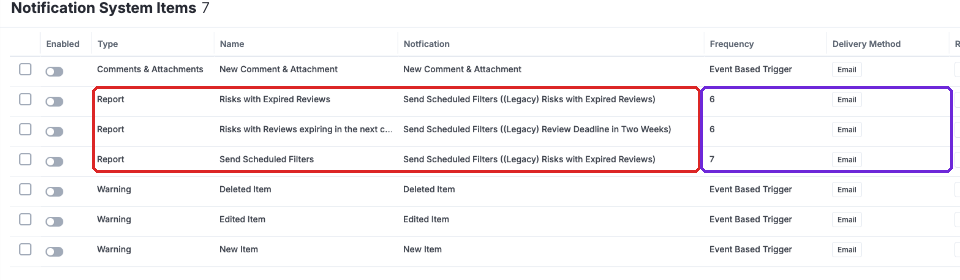
You can regularly send reports over email by creating Report Notifications, for example you can get your Risk report every week by email if you wish.
Theory
Report Strategy
Introduction
In this episode, we will describe the different strategies for creating and designing reports. eramba has over 250 different charts available for your reports.
Trajectory
Every module in eramba allows you to display over-time charts based on your own defined status. These charts allow you to clearly define your own "groups" (status) and display their trajectory over time.
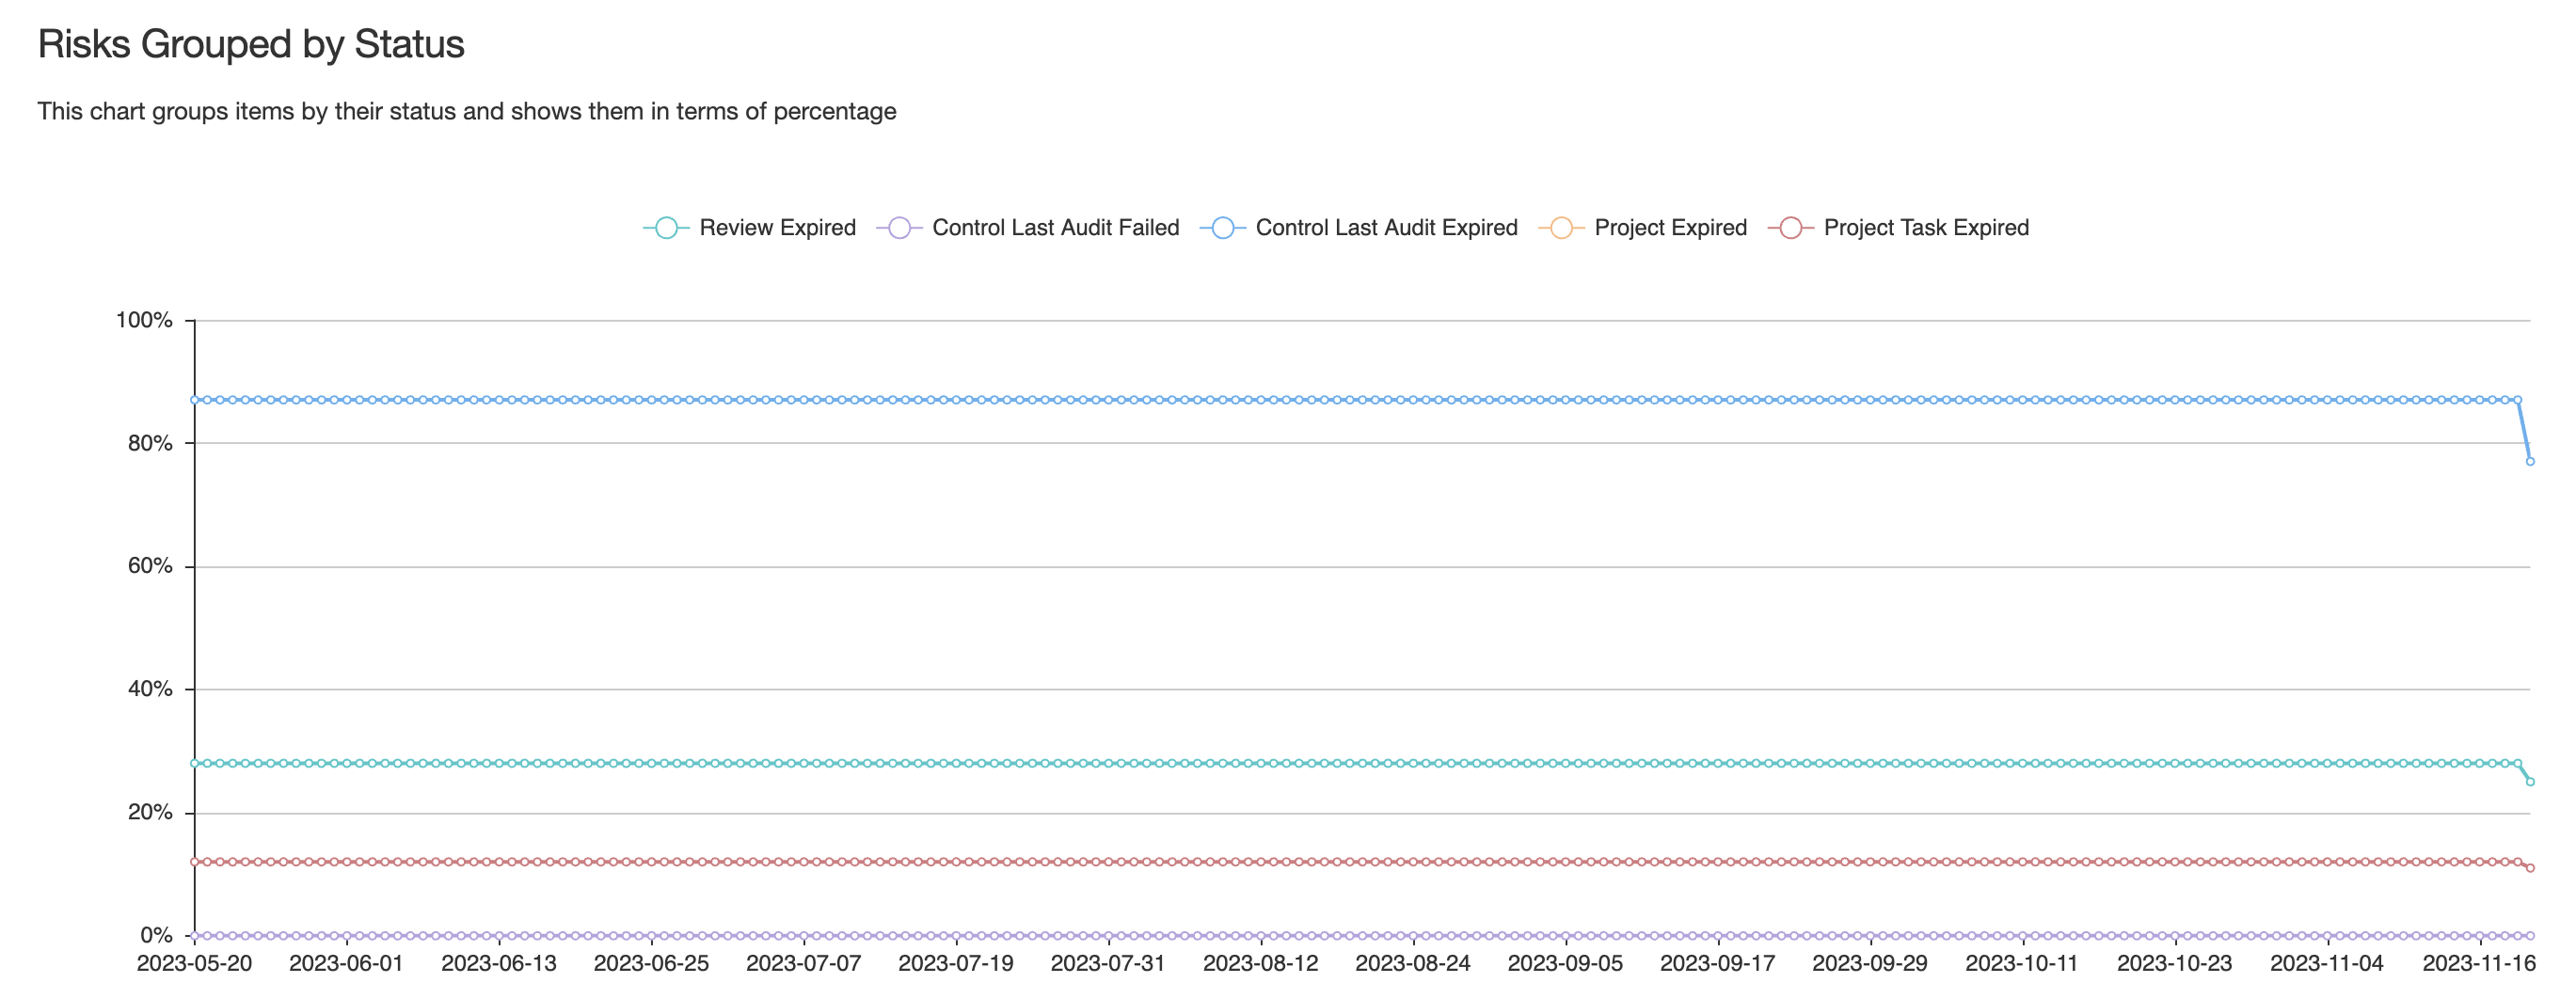
You can, for example:
- Group Risks that are "Expired" and track how many there are over time
- Group Risks by "Impact" and track down how many there are over time
- Group Compliance Requirements by treatment Status over time
- Group Policies not Reviewed over time by each of your team members over time
- Etc
This type of chart is typically sent over by email every week to monitor the progress of work.
Snapshot
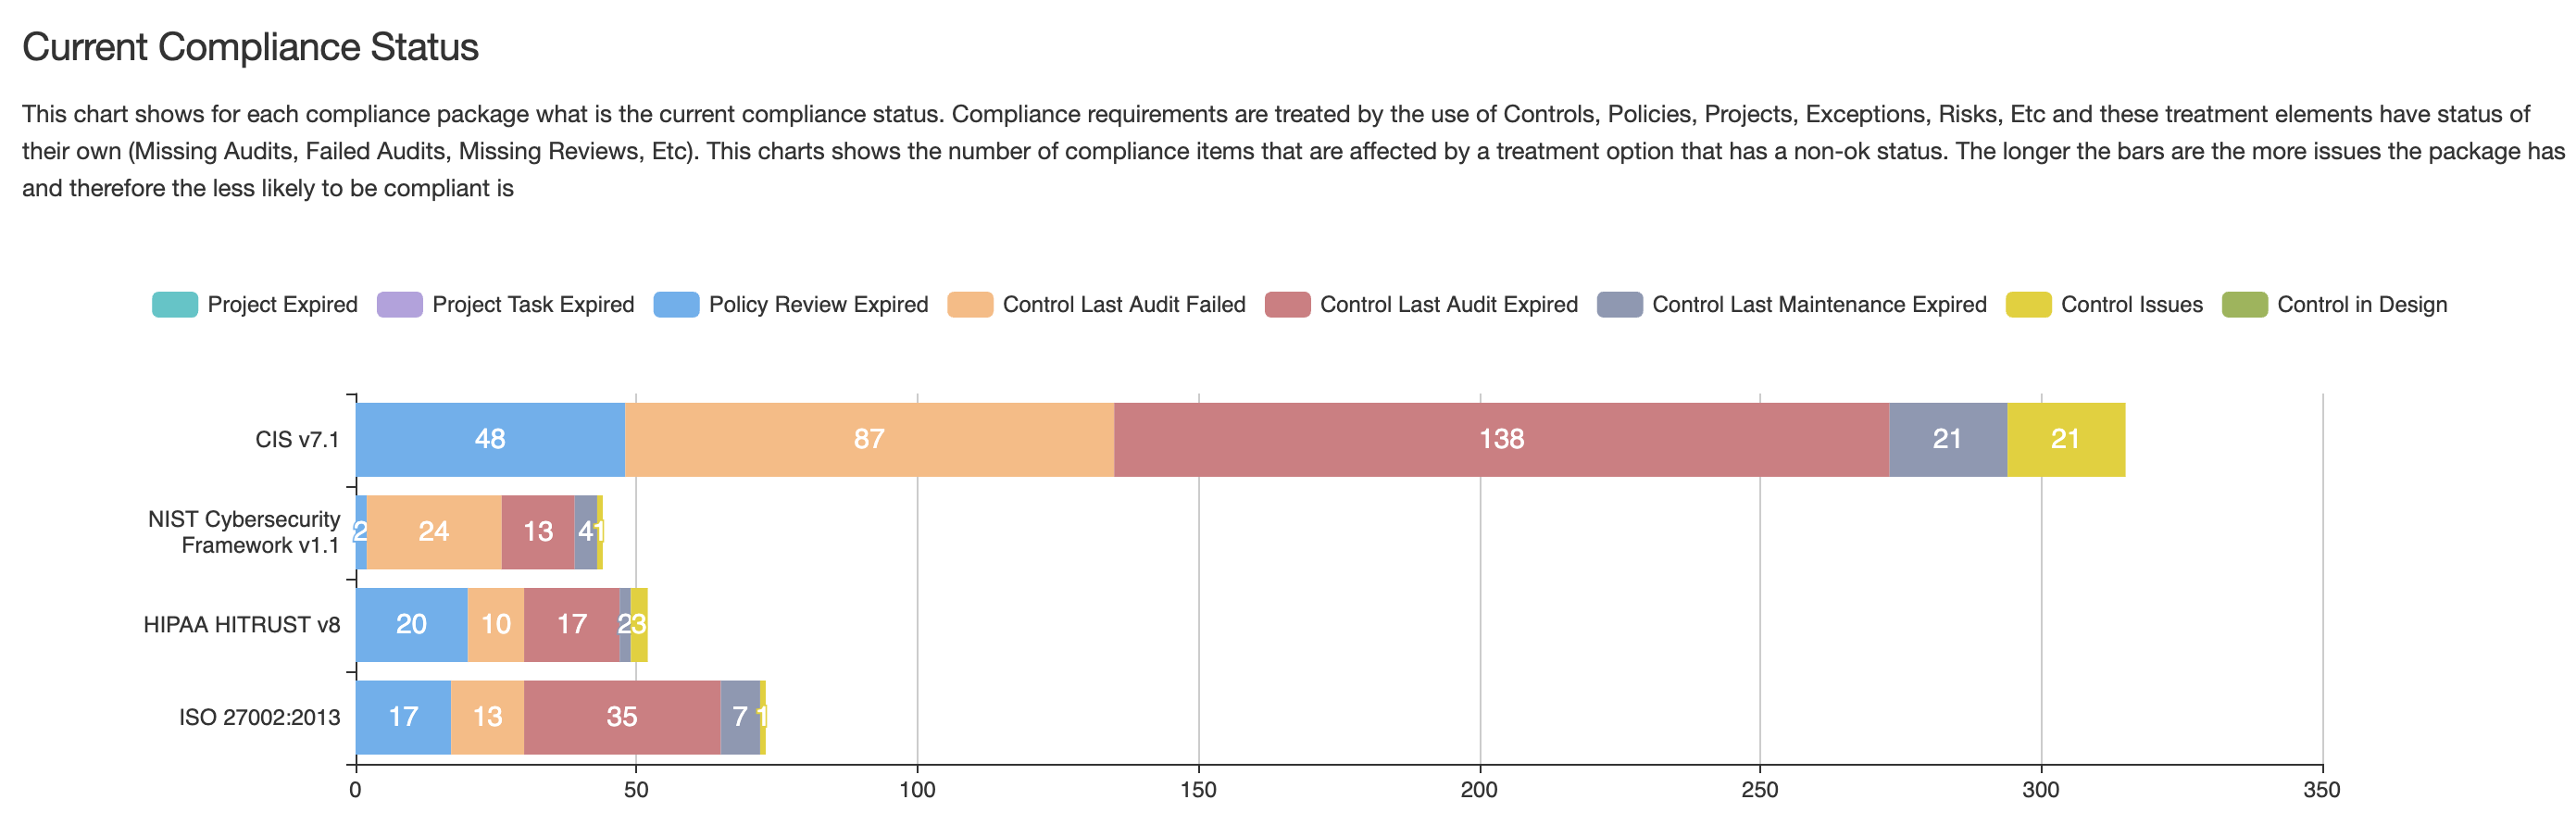
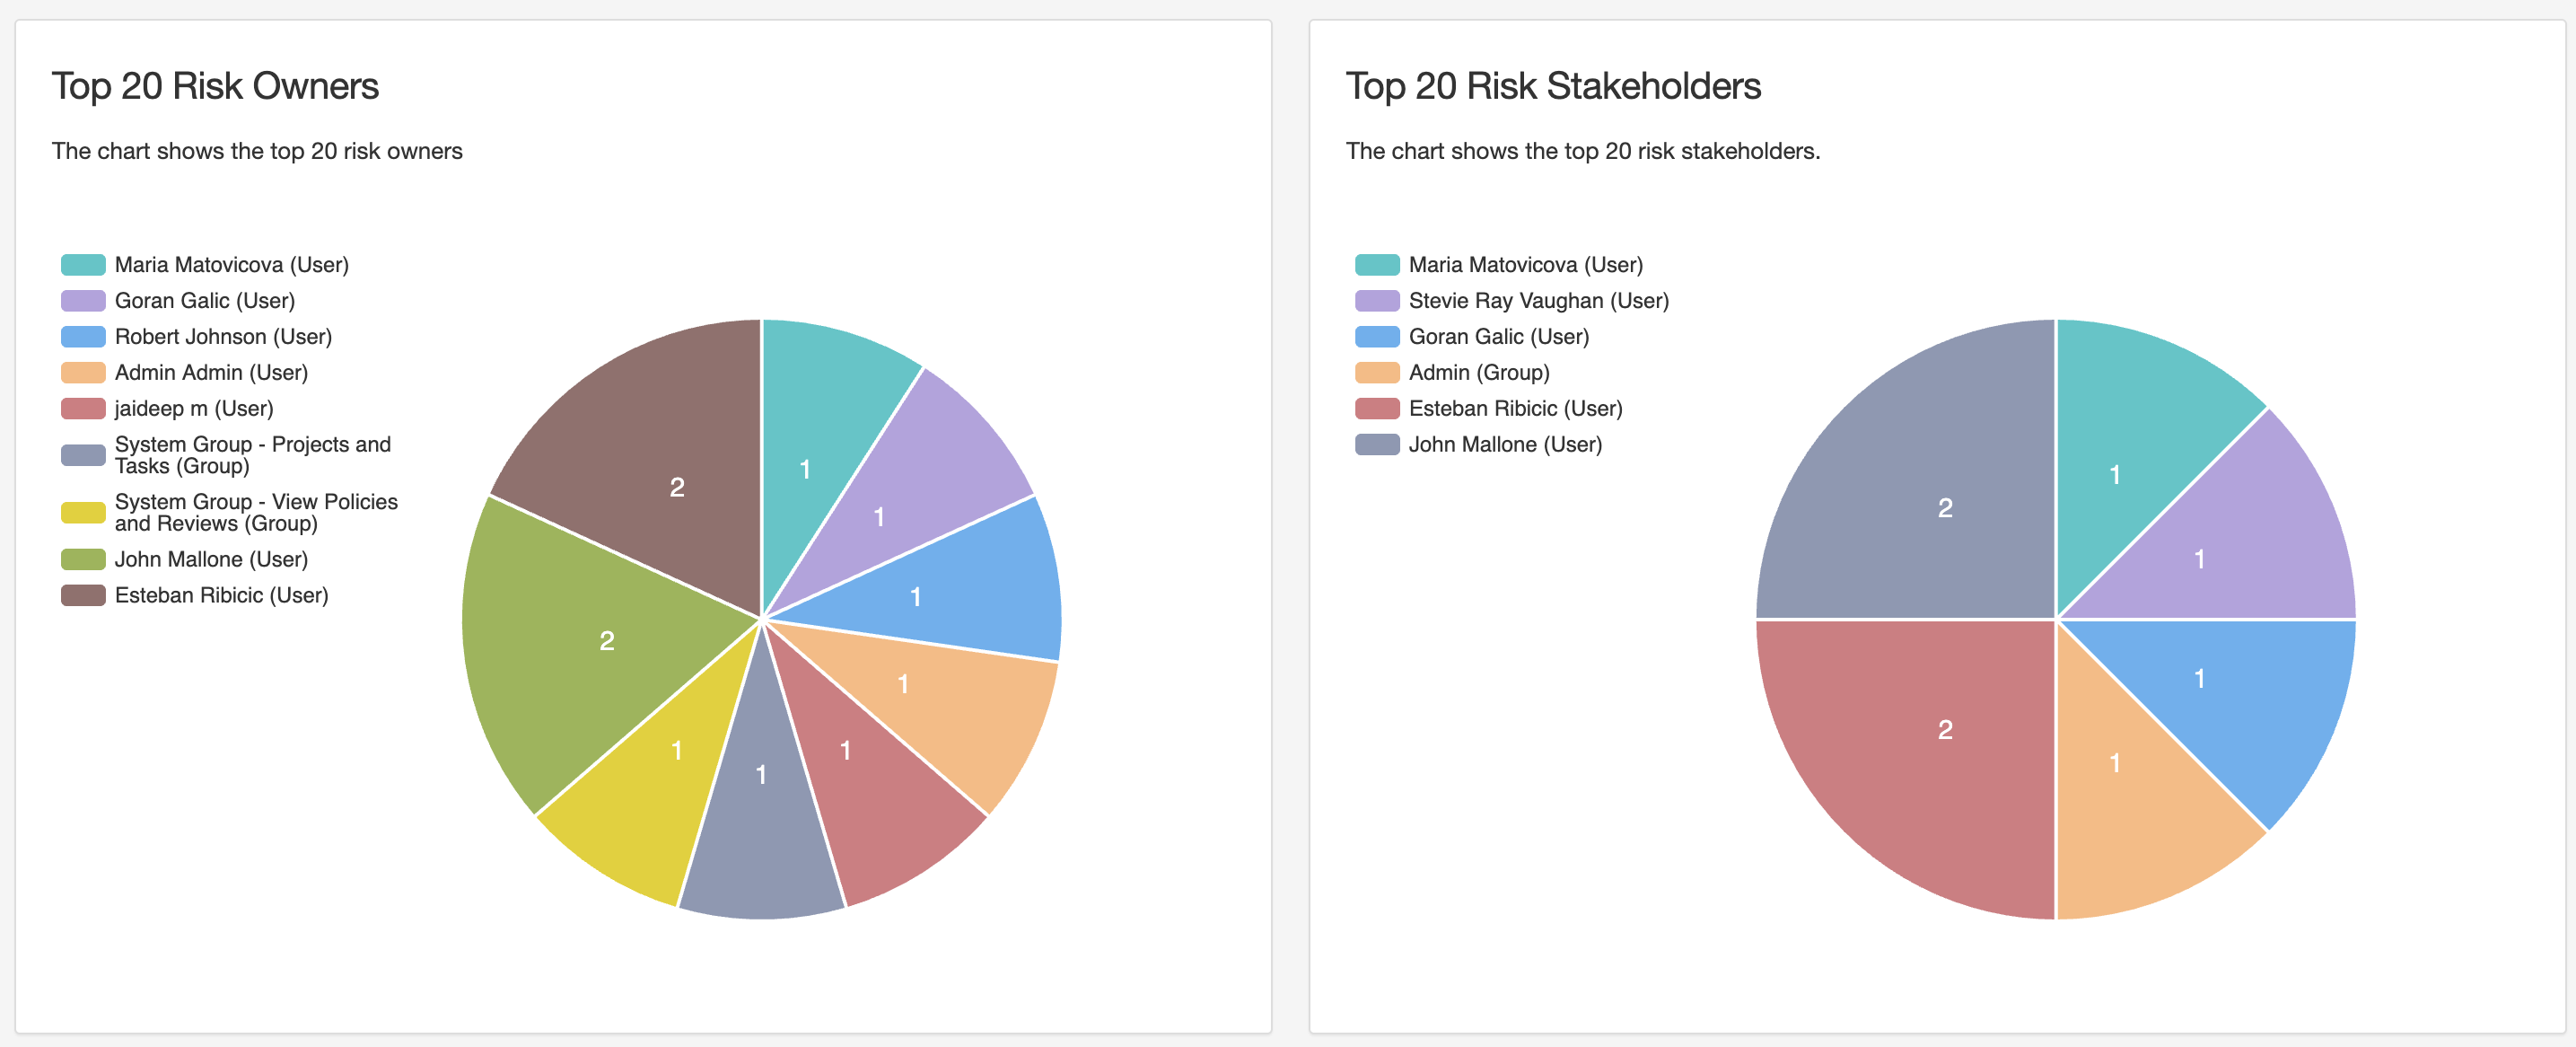
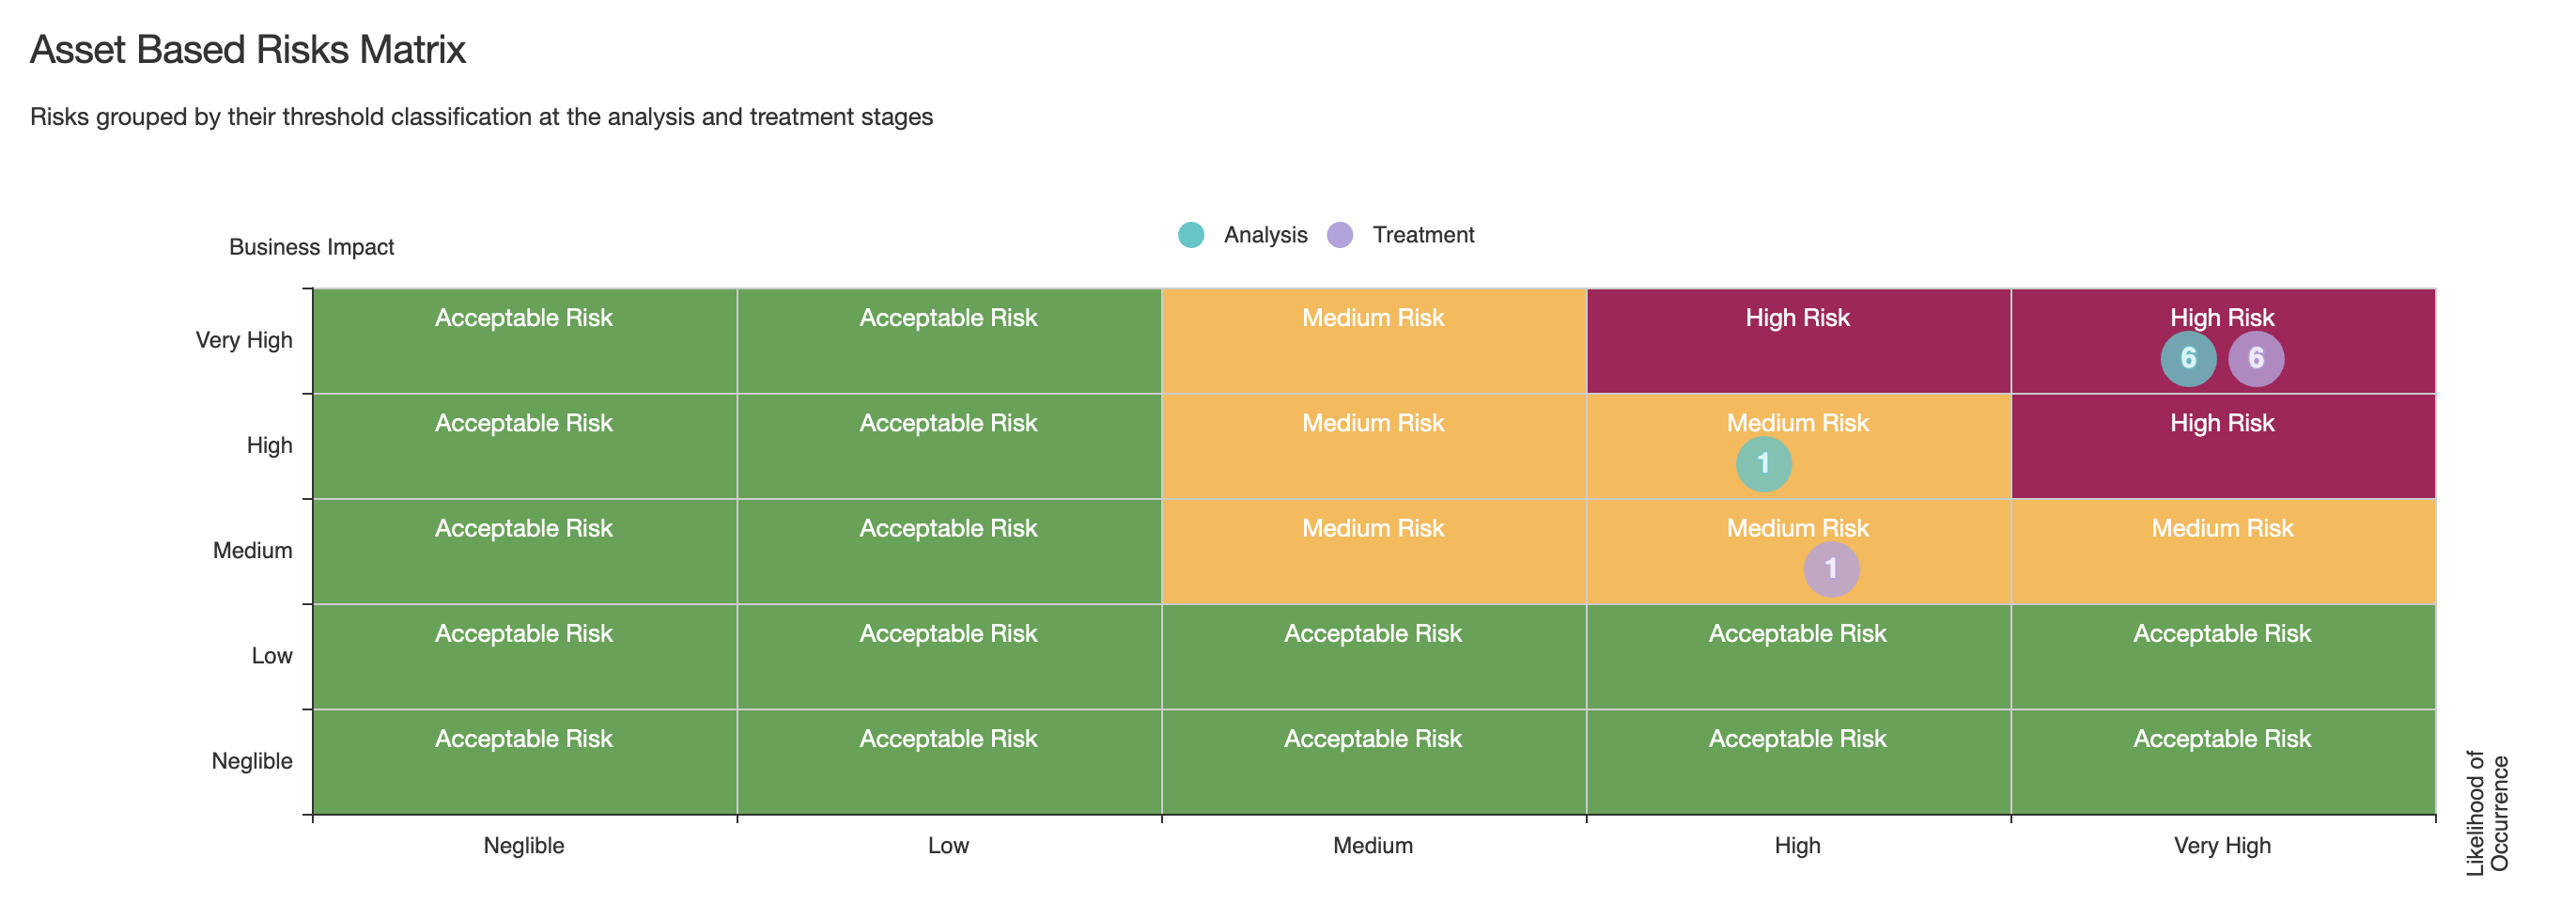
In every module in the software, you will also find pre-defined charts (you can not change the way they look or how they are calculated). In total, there are some 250 charts available to you. These charts do not show trajectories (as the ones explained above) but instead snapshot data points.
BI Tools
Reports can be made in eramba in three ways:
- Using Eramba-built reports
- Export data in CSV and use spreadsheets, etc
- BI Tools
If you are interested in using BI tools you can get data from eramba directly from the database (only read queries are allowed) or using built-in APIs.
Conclusion
For every use case, you have chosen in the first step of the implementation process you now know what modules will be used. You can then explore what charts are available on each one of these modules and start building your custom graphical reports.
You can also adjust the default landing dashboard in eramba to show data that relates to your use case alone (the default landing dashboard shows charts from multiple modules that might not be in your scope).
Types of Reports
Introduction
On every module, you will find two types of reports, Item and Section. There is a special report that is only shown on the landing page of Eramba (after login) called "Landing Dashboard".
Types
As explained in the introduction, in every module there are two types of reports:
- Section Reports
- Item Reports
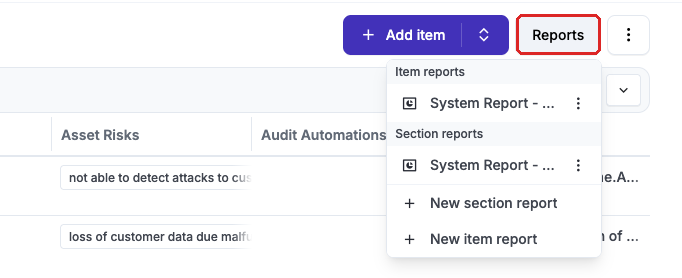
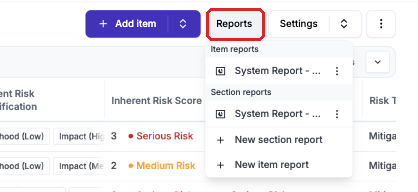
These reports are managed from the module menu bar, you will see the "Report" option and within that feature two options: Item and Section. In this menu, you can build as many report templates as you want for each type of report.
Item
A module in eramba will have data, every row you create on the module is typically called "Item". If you wish to see that item on a graphical way, not as a simple row in a table, then you will be using "Item Reports". This type of report works against a specific item.
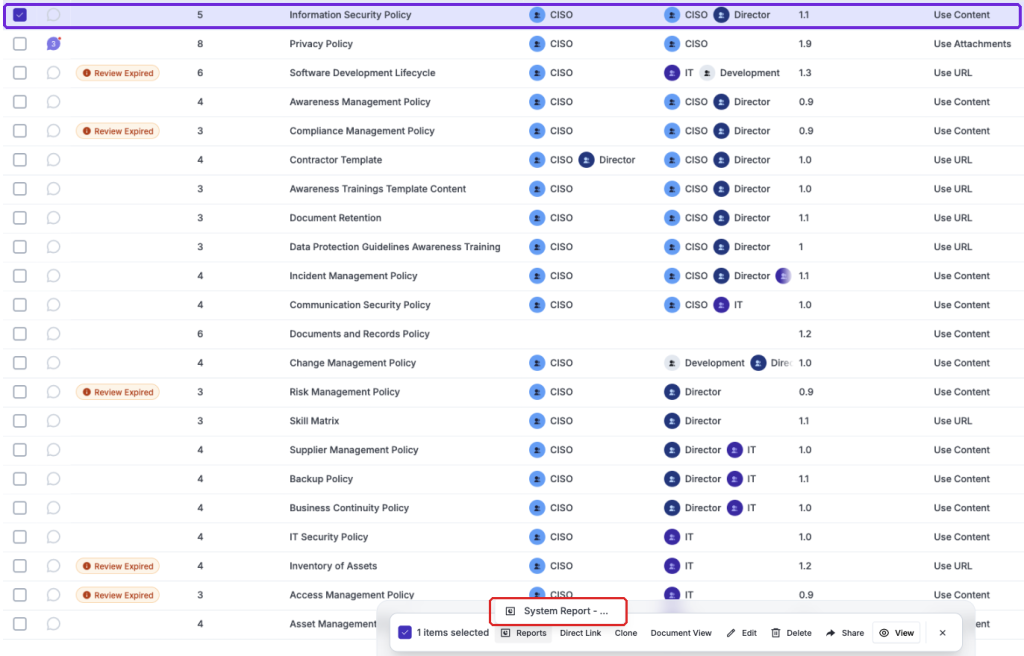
In this screenshot, you can see that on the Policy module, if you select an item and click on "Report" you will be displayed all possible report templates. Clicking on any of those report templates will display the report for that specific item.
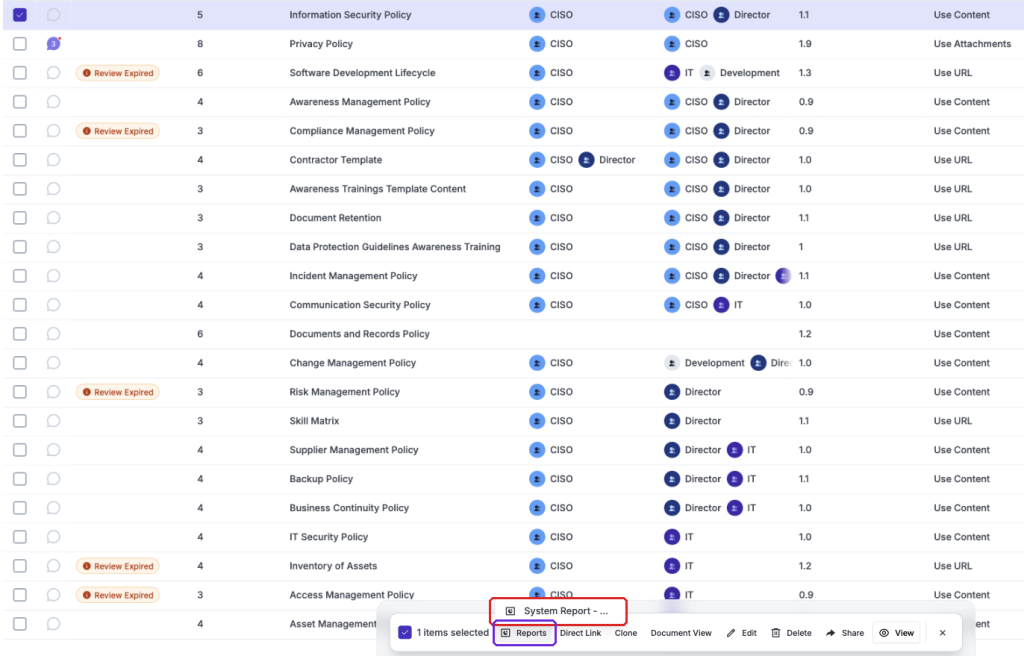
If you wish to execute an Item report, then you need to select the item for which you need a report, click on the menu item, Reports and select the template you wish to execute.
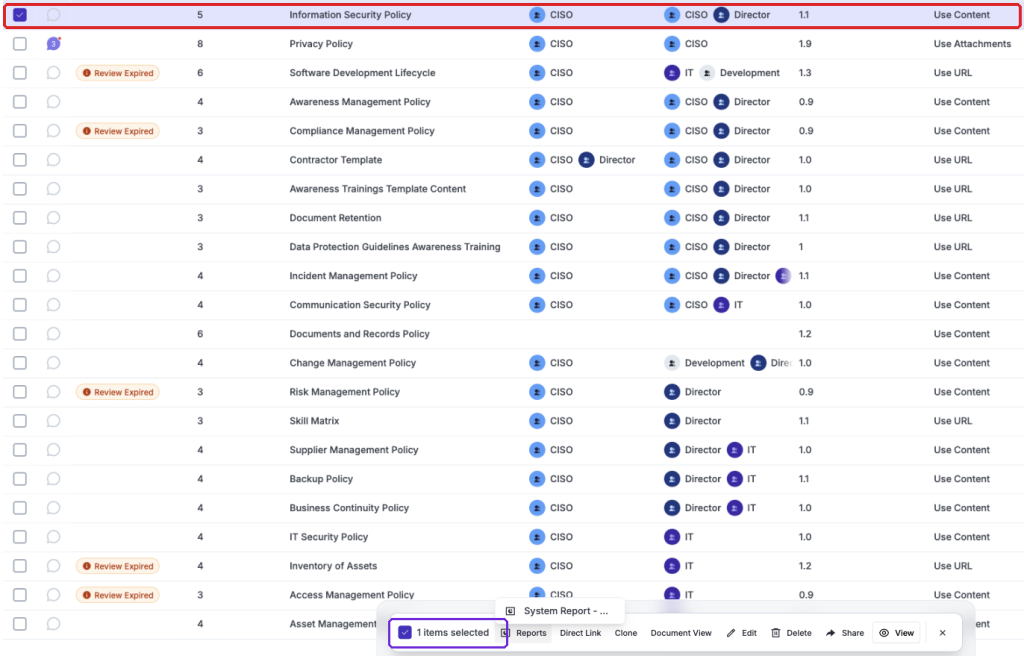
eramba will load the data of that particular input into the template you selected.
Section
Section reports work against ALL items on the module (not a subset). This means that when you create and launch a section report, eramba will take information from all items on the module and display them on the report.
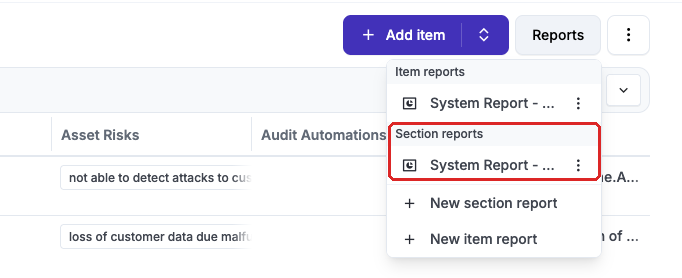
If you want to run a Section report, access the module you want to work with, click on Report / Section and then select the template you wish to execute and click on "View". This type of report will be populated using all data on the module.
Dashboard
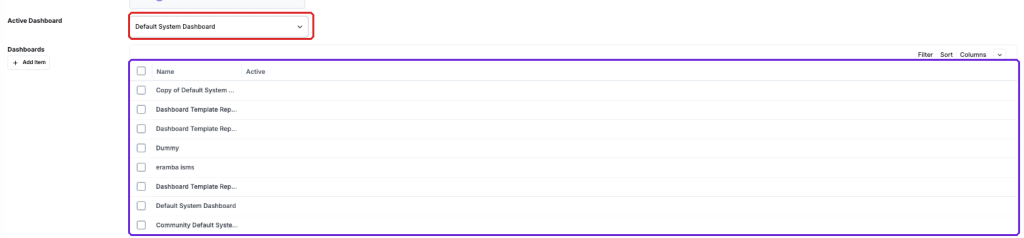
The Landing Dashboard is loaded automatically every time a user logs in to eramba, you can select what template is shown to users in Settings / Dashboard. The same dashboard will be shown to all users, there is no dashboard per user/group.
Templates
As previously shown, Item, Section and Dashboard reports in the end are generated based on templates you create.
Every type of template has different widget types, Section Widgets:
- Text: shows formatted text in your reports
- Filter: shows filters from the Filter module in your reports
- Chart: shows charts on your reports
Item Widgets has the same options as Section templates and:
- Table: shows a table that describes the item attributes as columns
Dashboard Widgets has the same options as Section templates and:
- Tasks: shows expired, current and future tasks
Template Settings
Introduction
In this episode, we explain in detail what components (widgets) a template can include and how they can be manipulated in order to create a template.
Template Builder
The report builder is accessible from the menu bar under the "Report" option. Every type of report has a slightly different option to create new templates:
- Section Report: on any module, click on Report / Section / New
- Item Report: on any module, click on Report / Item / New
- Landing Dashboard: click on Settings / Dashboard / Actions / New
The builder requires you to do the following:
- Provide a name for your template
- Drag and Drop Widgets into the template
- Re-organize the widgets (up, down, right, left)
- Configure widget settings
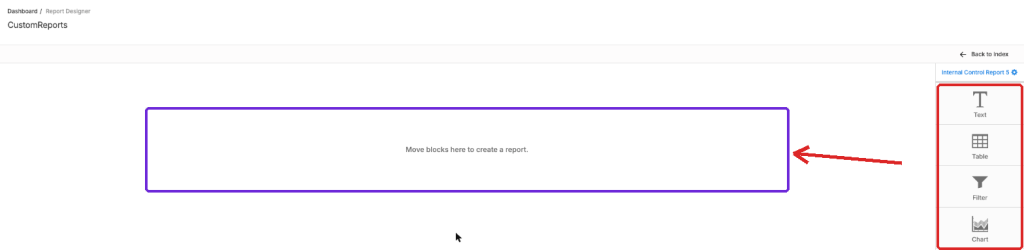
The rest of this episode focuses on the type of widgets available for your reports.
Text Widget
The text widget is available on all three types of reports and allows you to include any kind of formatted text.
In the case of "Item Reports" you can also include macros for the item attributes (title, description, etc). This feature is not possible in "Section Reports" as the report is generic to all items and not one in particular
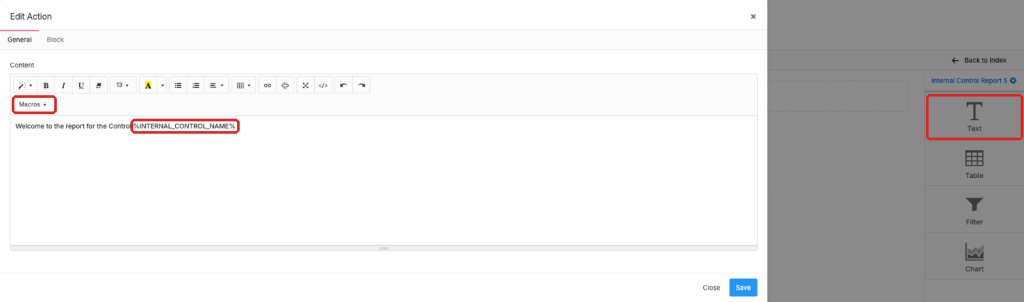
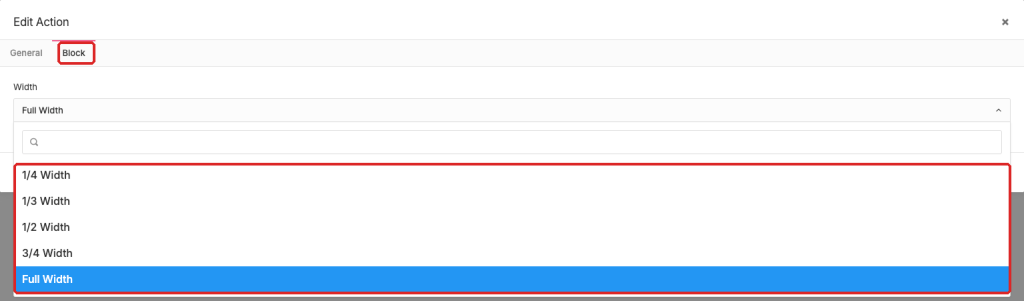
The widget can have multiple width sizes
Filter Widget
The filter widget is available on all three types of reports and allows you to include an existing filter (review Filter Course for details) in the report.
You need to select the filter you want to display (is useful to configure your filters with a "Limit" option to list for example your "Top 10 Risks" in a report).
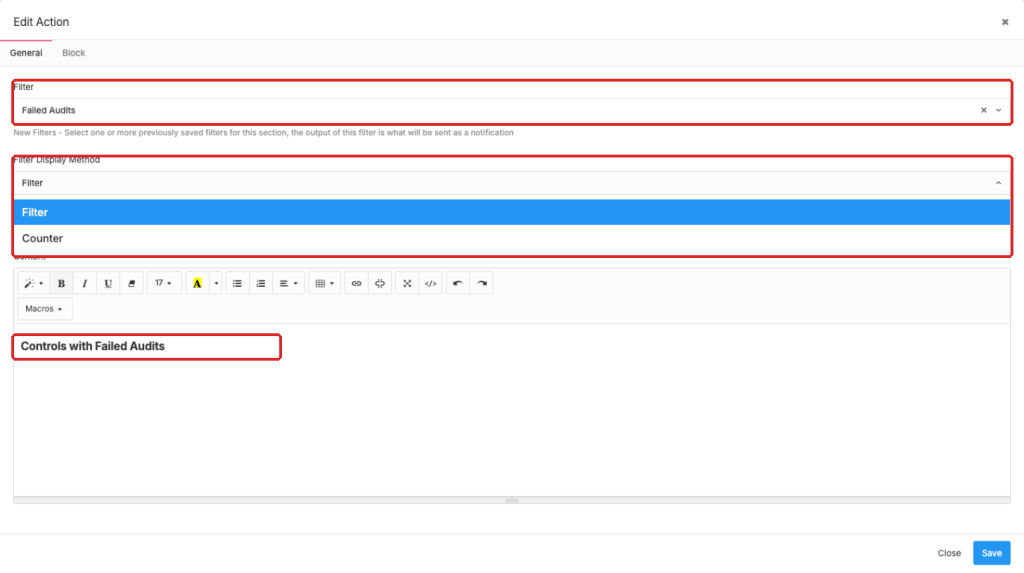
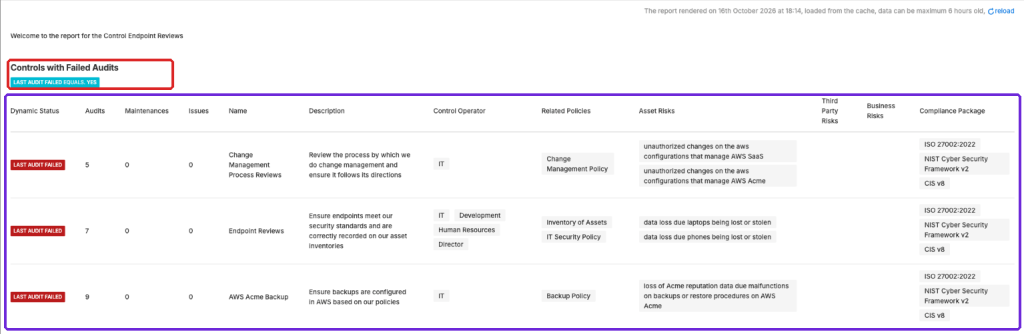
You also need to configure if you want to see the full list of items as the filter would show or just the counter of items. Either way, you can include any text you want in the widget.
Table
The table widget is only available on the "Item Report" and is used to describe an item in detail.
You need to select from which tab (if the module you are in has more than one tab) you want to pick up the item fields, what fields you want to show, in which order you want to show them and some text on the widget (including macros).
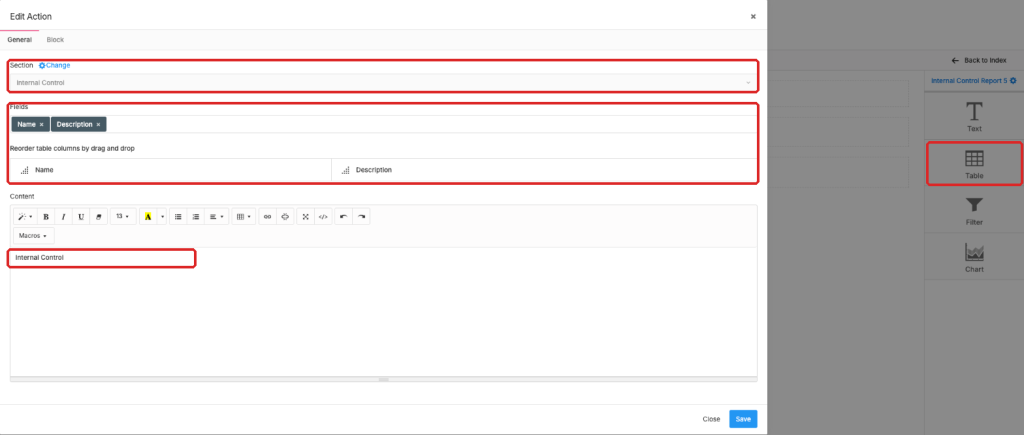
If you are on a section with more than one tab, for example Policy module you can show the table for the policy and a second table for its reviews (just make sure you change the table on the widget to Reviews). The table once loaded looks as the screenshot below.

Task Widget
The task widget is only available on the "Landing Dashboard" report and shows items (Risk Reviews, Projects, Tasks, Audits, etc.) based on their deadline.
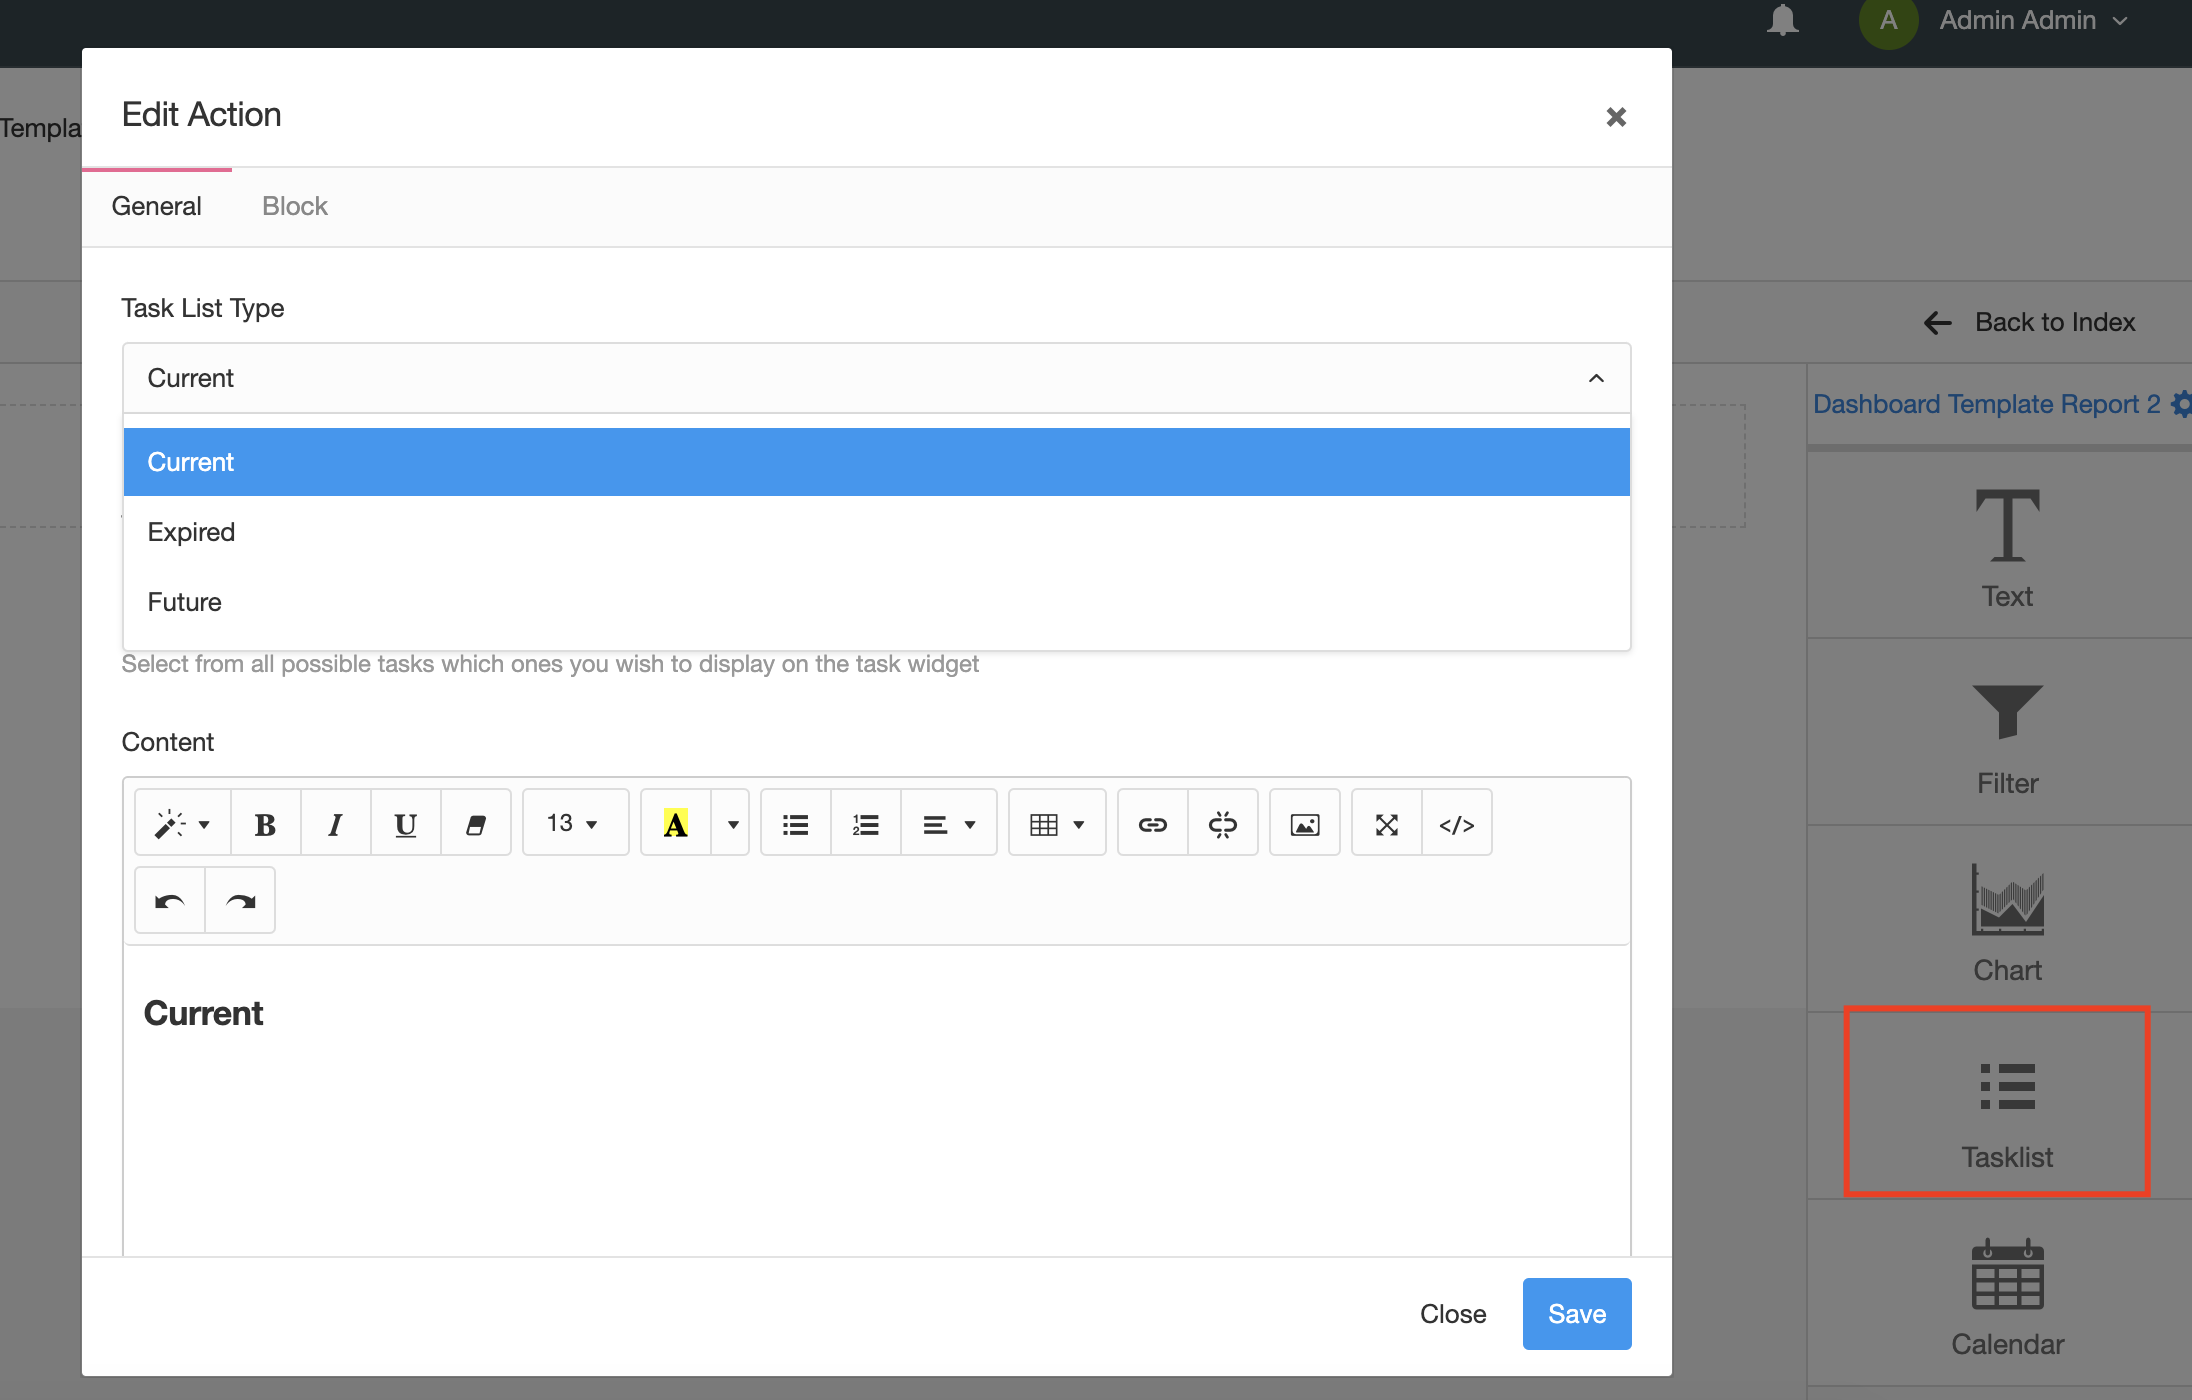
You need to select which type of deadline you want to show (Past, Current or Future) and then which items (Risks, Projects, etc.). Typically you can fit all three deadlines in one row by making the block size to 1/3 of the screen.
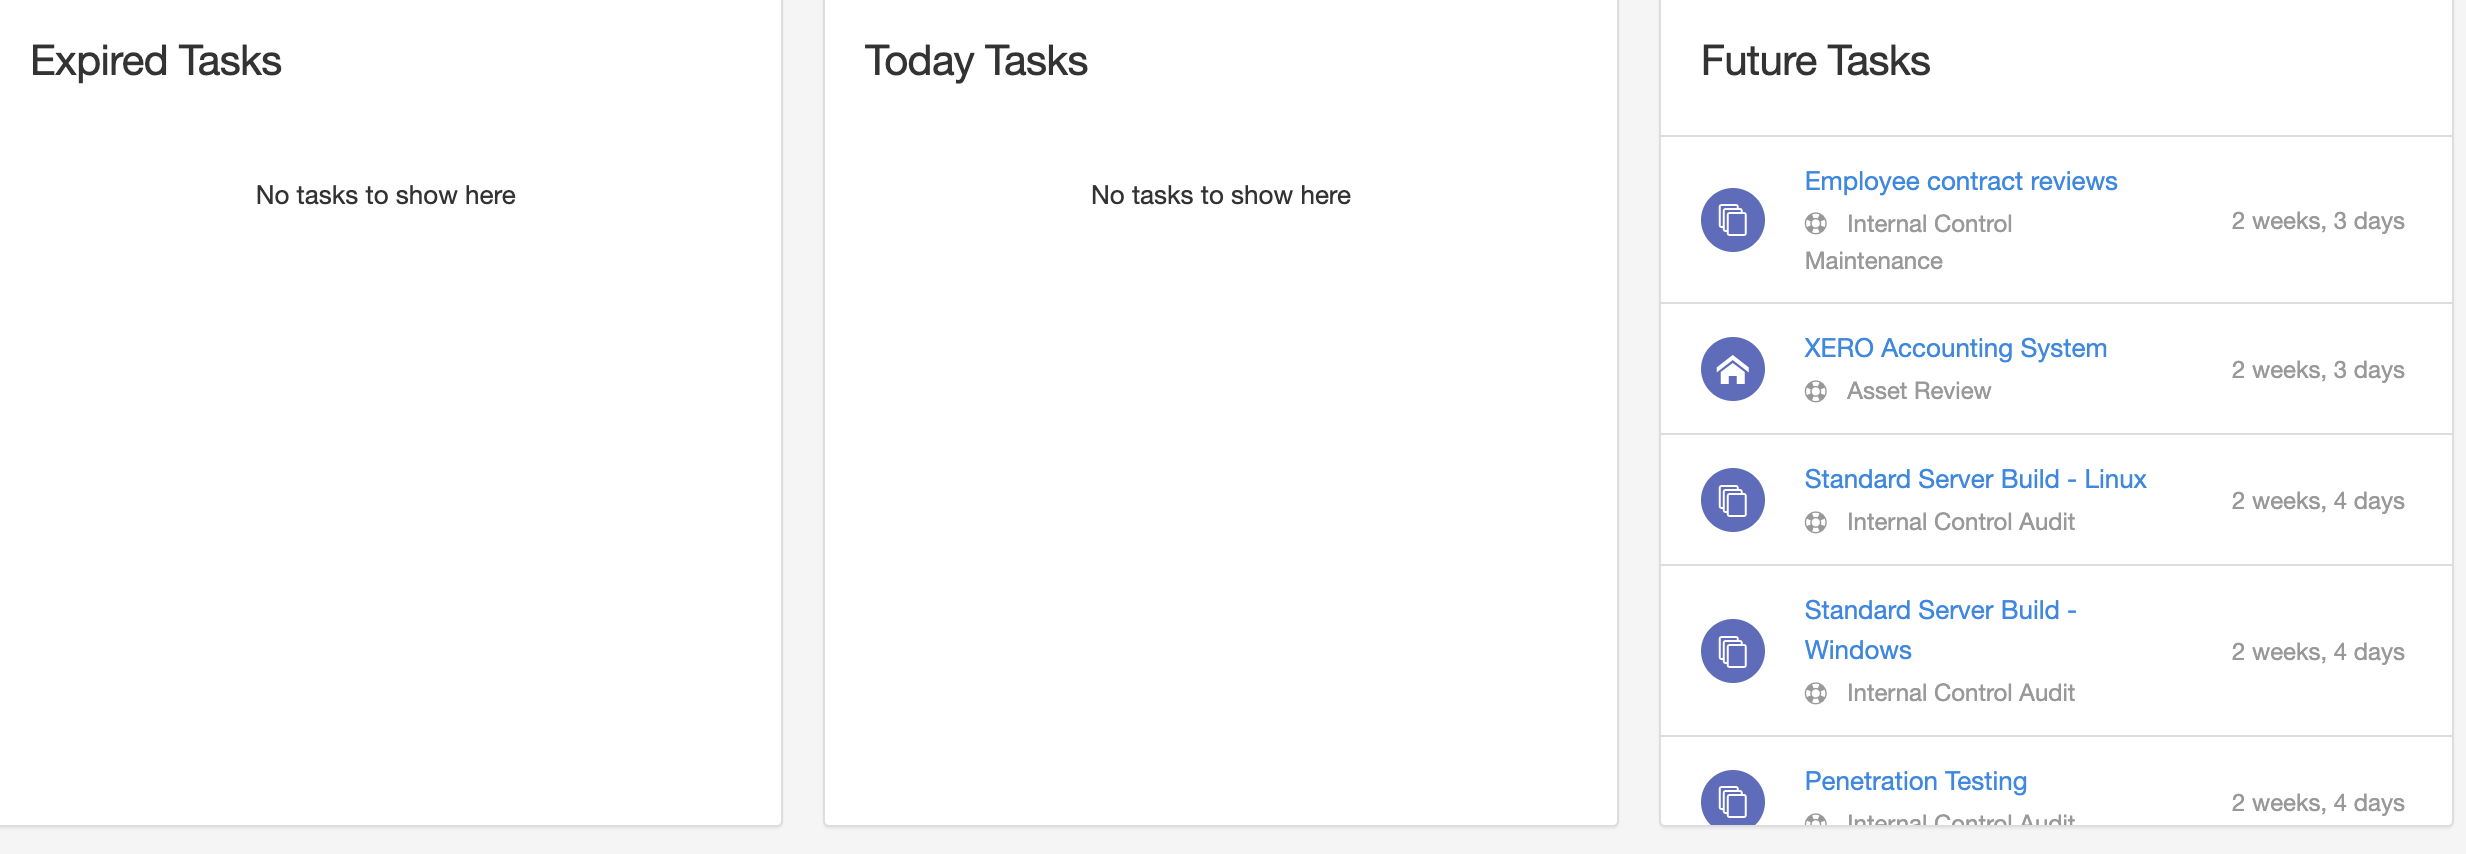
Chart Widget
The chart widget is available on all types of reports and is made of multiple charts (pie, overtime, vertical bars, risk matrix, etc).
These are hard-coded charts - you can not modify them in terms of how they are calculated or what colours or types of charts they use.
When you drag and drop the chart widget into the report you need to select the section from which you want the chart to originate (by default you will be shown the charts for the section you are located) and then the type of chart.
This means that you can, for example, use a chart from the Internal Control module even if you are working in the Risk module.
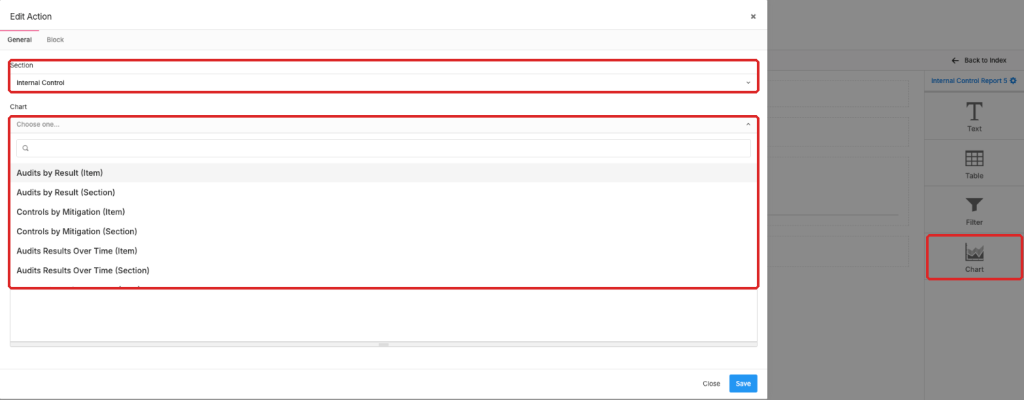
If you are building a Section report you will only be shown a "Section" type of charts, if you are building an Item report you will see both "Item" and "Section" charts. This is because some charts are designed to show data from a single item rather than from a collection of items.
Once you drag and drop the chart and select a chart you can adjust the text and block size.
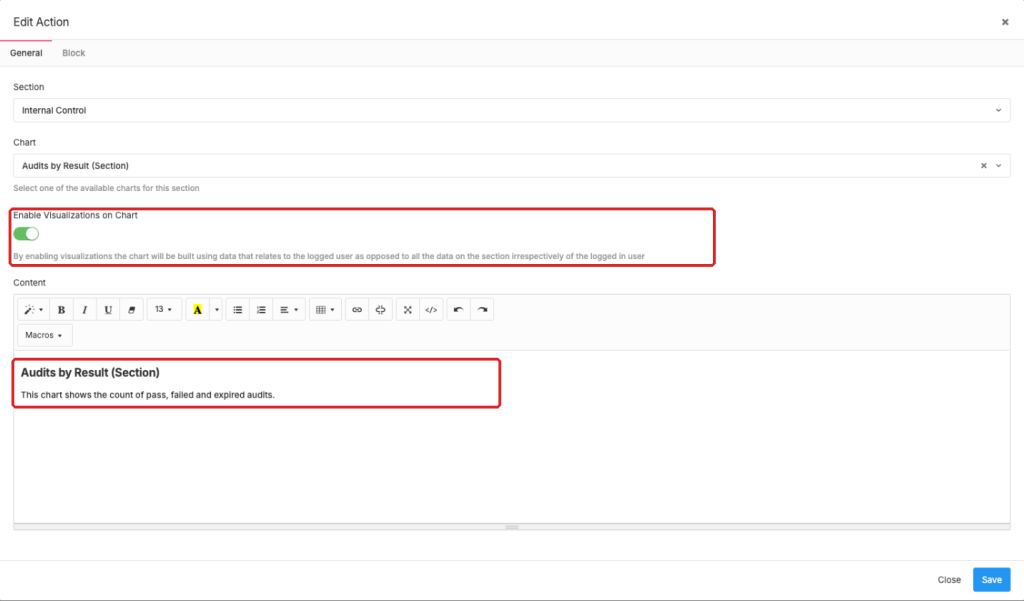
Visualisation settings will affect what users will see on these charts (review visualisation concepts), if you would like to avoid visualisation from taking effect you can disable the toggle and everyone (no matter who logs in) will see the same charts based on all data on the system.
System Charts
eramba includes "System Charts" in all modules, these charts do the same thing no matter in which module you are.
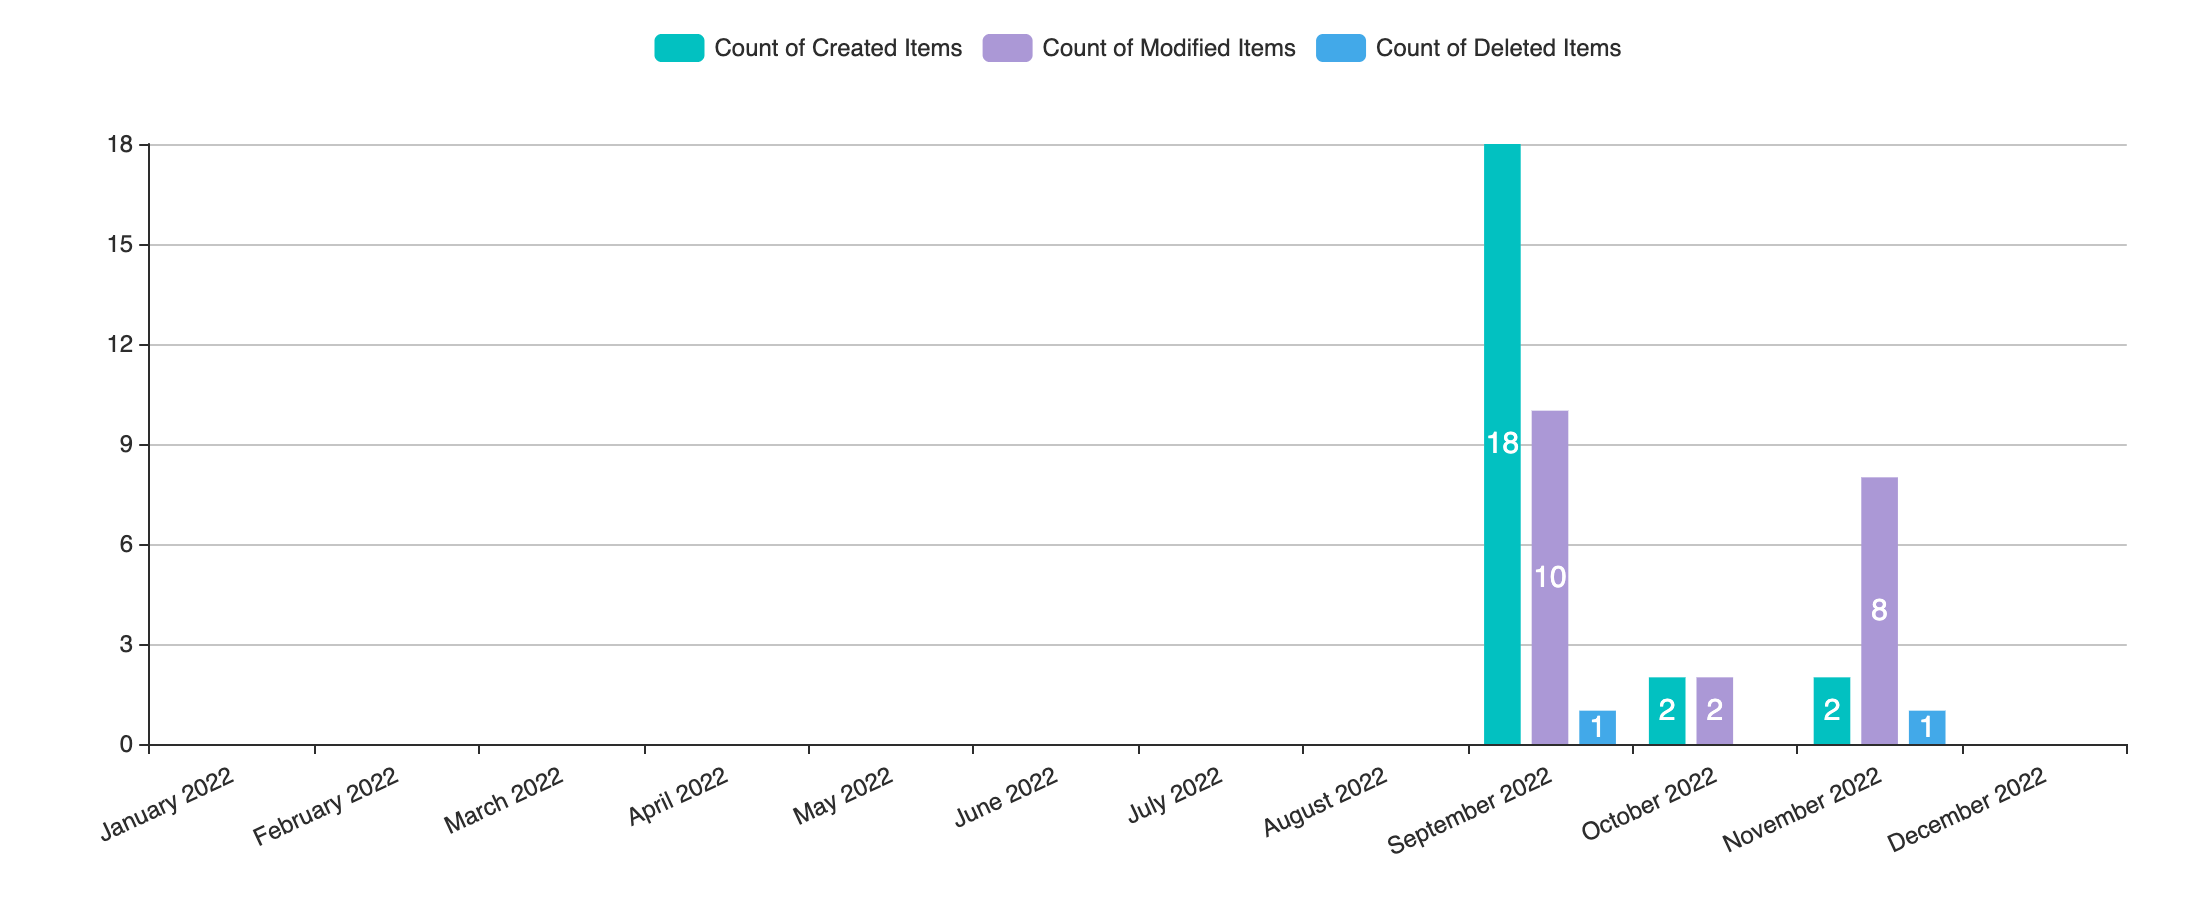
CRUD Charts show with vertical bars, how many items where created, deleted and modified per month.
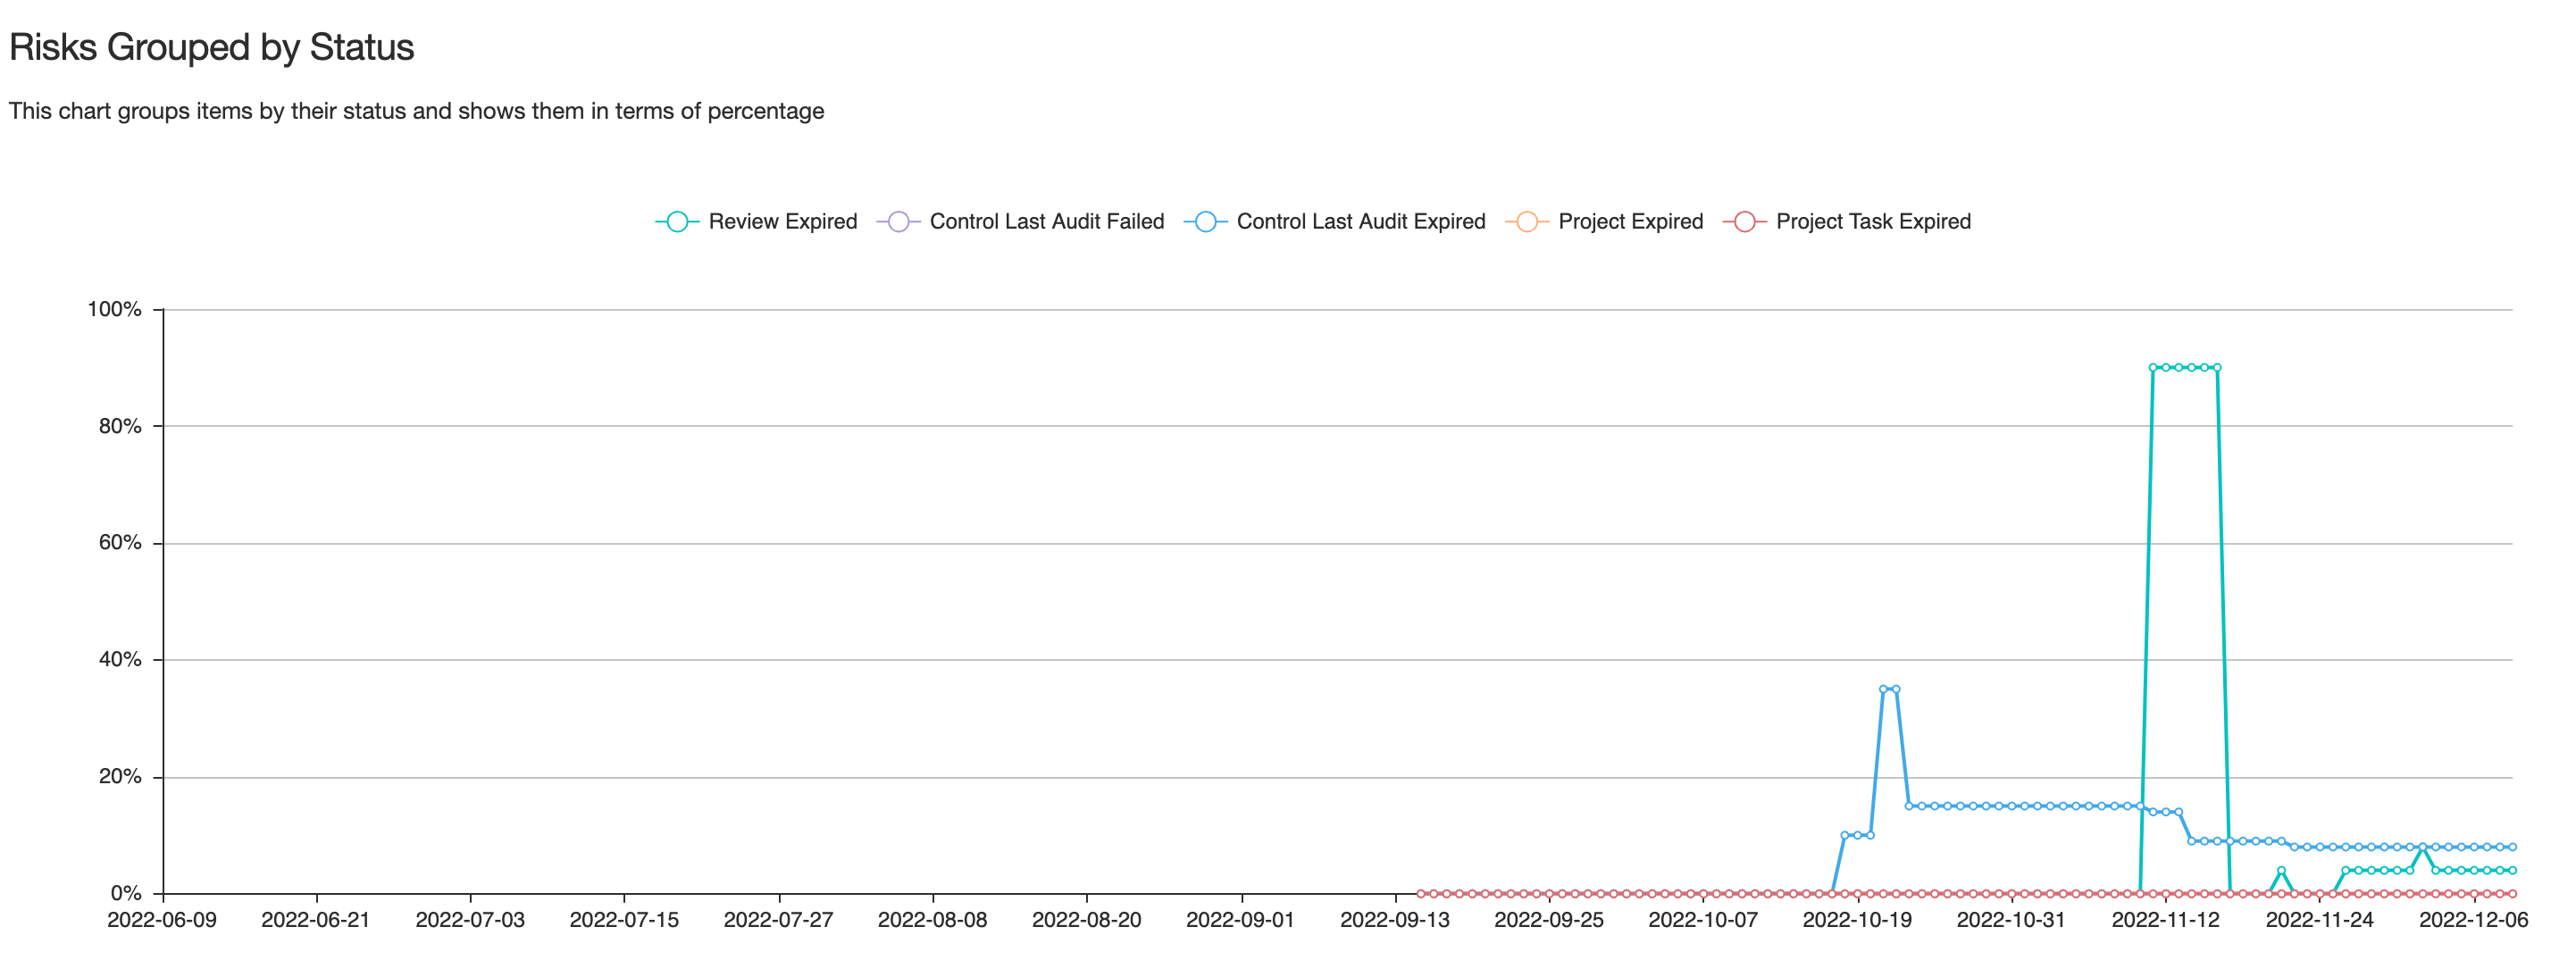
Status by Group charts show an overtime chart grouped by the statuses from that section. You can configure this chart to tell what Statuses you wish to see on the chart.
System Reports
Introduction
In this episode, we explain the difference between System and Custom reports.
System
eramba ships with at least one default Item and Section report on (almost) every module. You can see these default reports by accessing the Report menu option. System reports are always called "System Report - (Item|Section)".
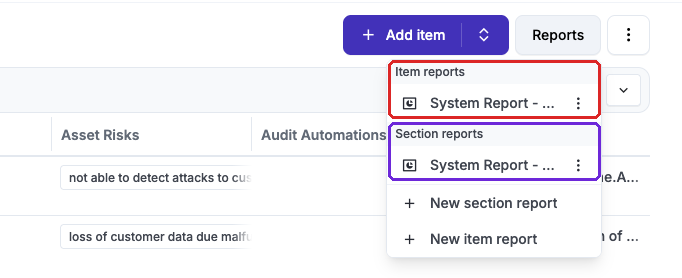
These reports can not be edited, deleted or renamed but they can be cloned, this allows you to re-use their design and modify it to your own needs.
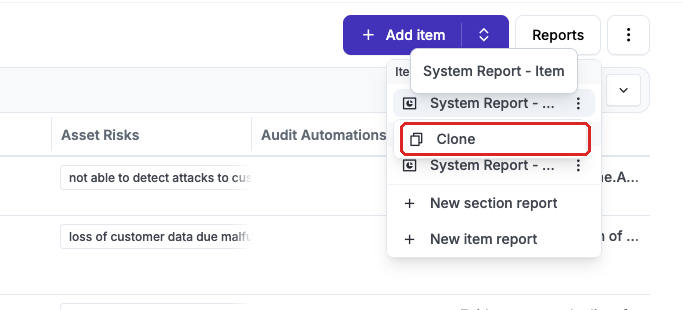
Once cloned you will be able to edit the report and modify it to your own needs.
Operation
Adjust Reports
Introduction
In this episode, we explain to you the process of creating new templates and modifying existing templates (system or your reports).
Process
The process to create or modify reports is described in the diagram below. You first need to decide if you will be creating a report from scratch or you will re-use a system report or a report that someone already created in eramba. This is important because System reports can not edited, you will need to first clone it and then edit the cloned version.
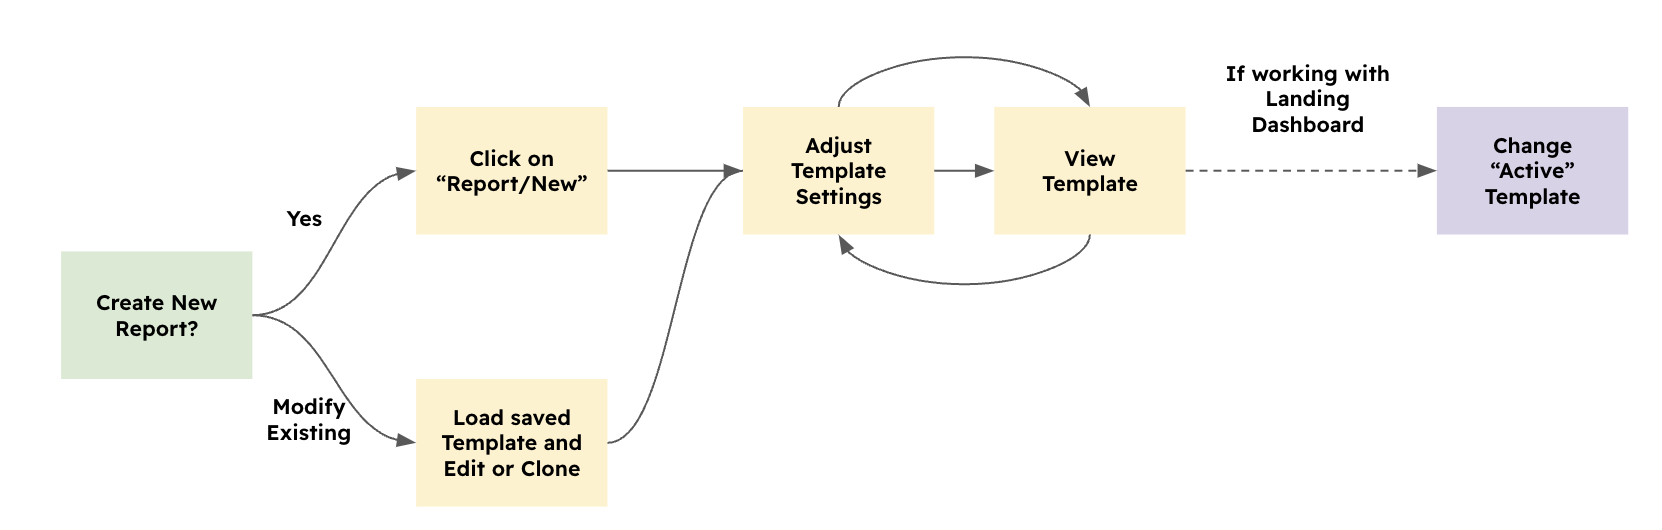
You then will access the report template editor, here you will be adjust widgets, save your modifications, and load reports to check if they look good or not. You may repeat these steps many times until you get it right.
If you are working with the landing dashboard (System / Dashboard Template) after making your modifications you will need to tell eramba that you want your new report to be the default.
Modifying Templates
If you do not want to create a new template, then you need to first edit an existing report template (from the Report menu) or clone it if you want to make a sort of backup or you want to re-use a system report.
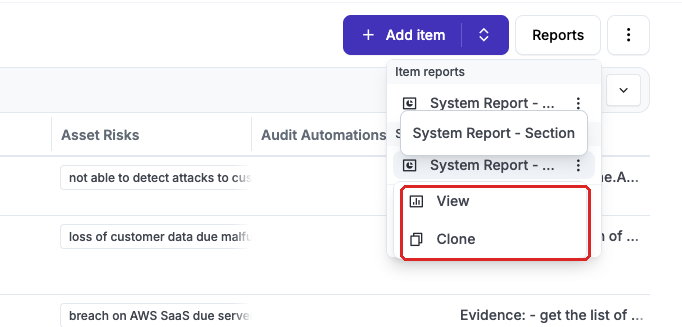
Once the template is loaded, you need to adjust its settings and design and then test it (run it) until you are satisfied with its outputs.
Creating a Report
Depending on the type of report you wish to create you need to follow these steps to create a new template:
- Section Report: on any module, click on Report / Section / New
- Item Report: on any module, click on Report / Item / New
- Landing Dashboard: click on Settings / Dashboard Templates / Actions / New
Once the template opens you need to drag and drop widgets, design the page, adjust widget settings and visualise the report to ensure it looks the way you want.
Report Builder
In this phase, you will use the report builder widgets to create or modify your report. Remember every widget can be customized once you drag it on the template.
Report Preview
Once you made your modifications to the template using the report builder, you can load these reports to validate if they do what you need. Section reports are loaded from the top menu bar as shown on the screenshot below.
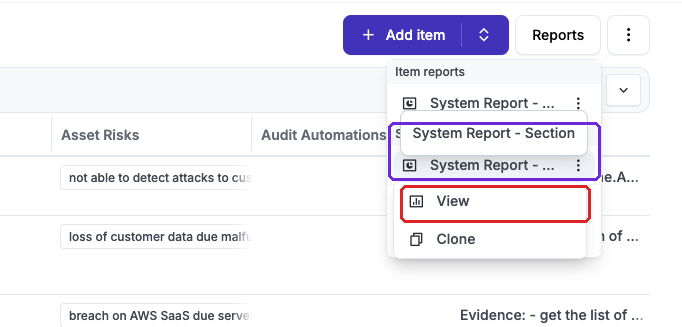
Item reports are loaded by selecting any item on the module and loading the report as shown in the screenshot below.
Reports are cached for some hours, if your data changes your reports might not pick up those changes due to caching settings. You can try resetting the report to use fresh data using the option shown in the image below.

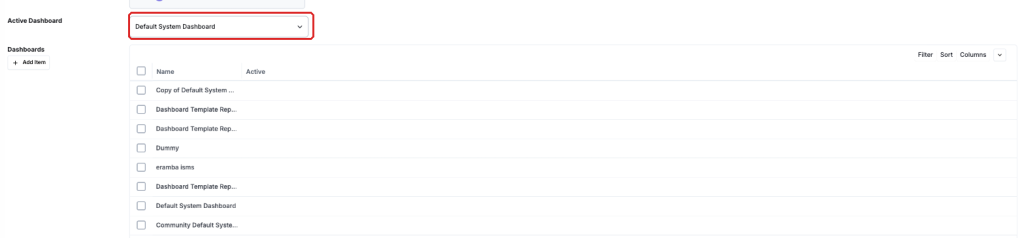
Your dashboards can not be previewed, you need to activate them on the system, log out and then log in to preview them. Click on the top menu bar in "Active Dashboard", select the template you wish to use and then save.
Still have questions?
Write to support@eramba.org or ask the community on the forum.