Report Strategy
Define your Report strategy
Introduction
In this episode, we will describe the different strategies for creating and designing reports. eramba has over 250 different charts available for your reports.
Trajectory
Every module in eramba allows you to display over-time charts based on your own defined status. These charts allow you to clearly define your own "groups" (status) and display their trajectory over time.

You can, for example:
- Group Risks that are "Expired" and track how many there are over time
- Group Risks by "Impact" and track down how many there are over time
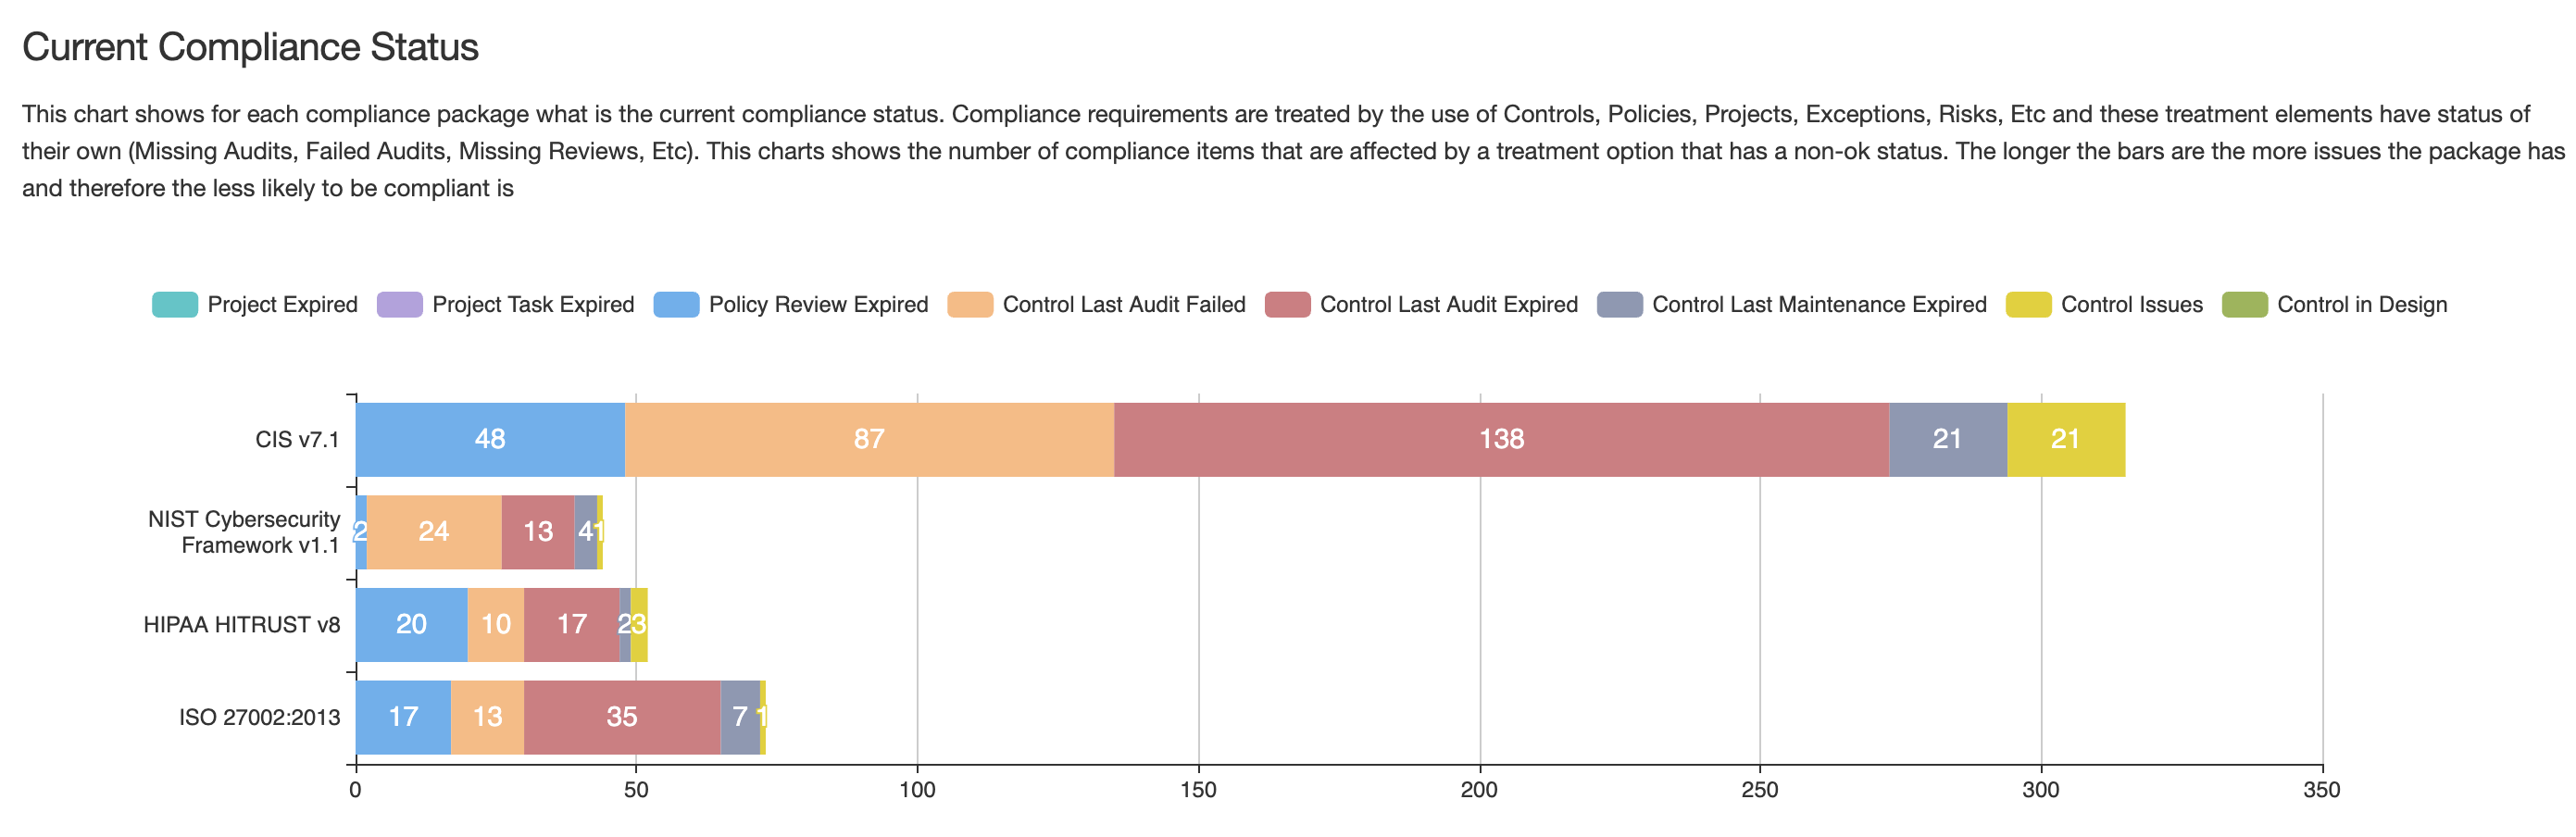
- Group Compliance Requirements by treatment Status over time
- Group Policies not Reviewed over time by each of your team members over time
- Etc
This type of chart is typically sent over by email every week to monitor the progress of work.
Snapshot
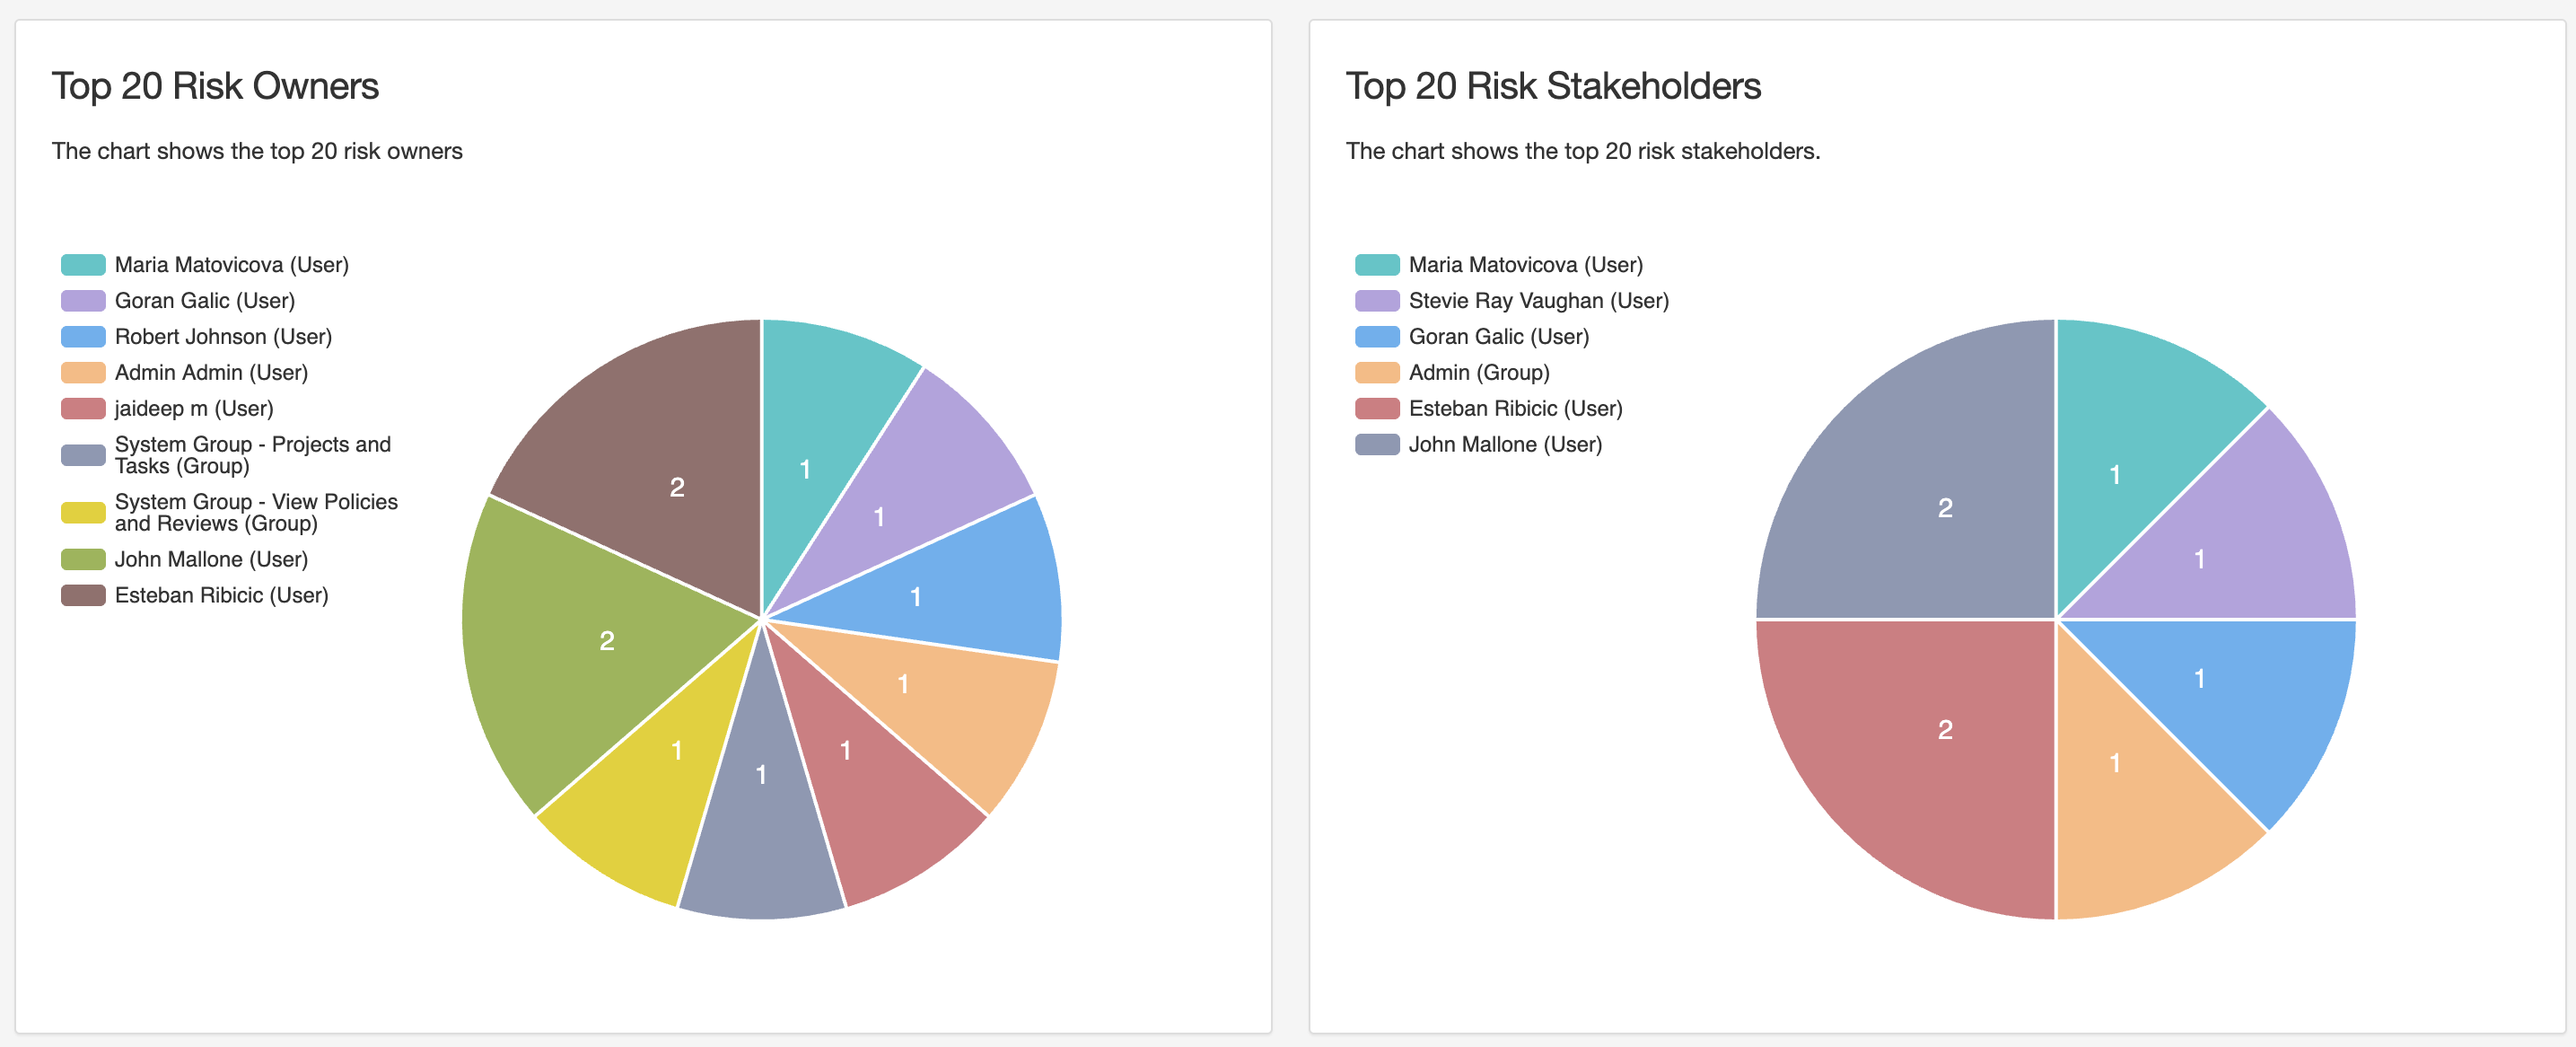
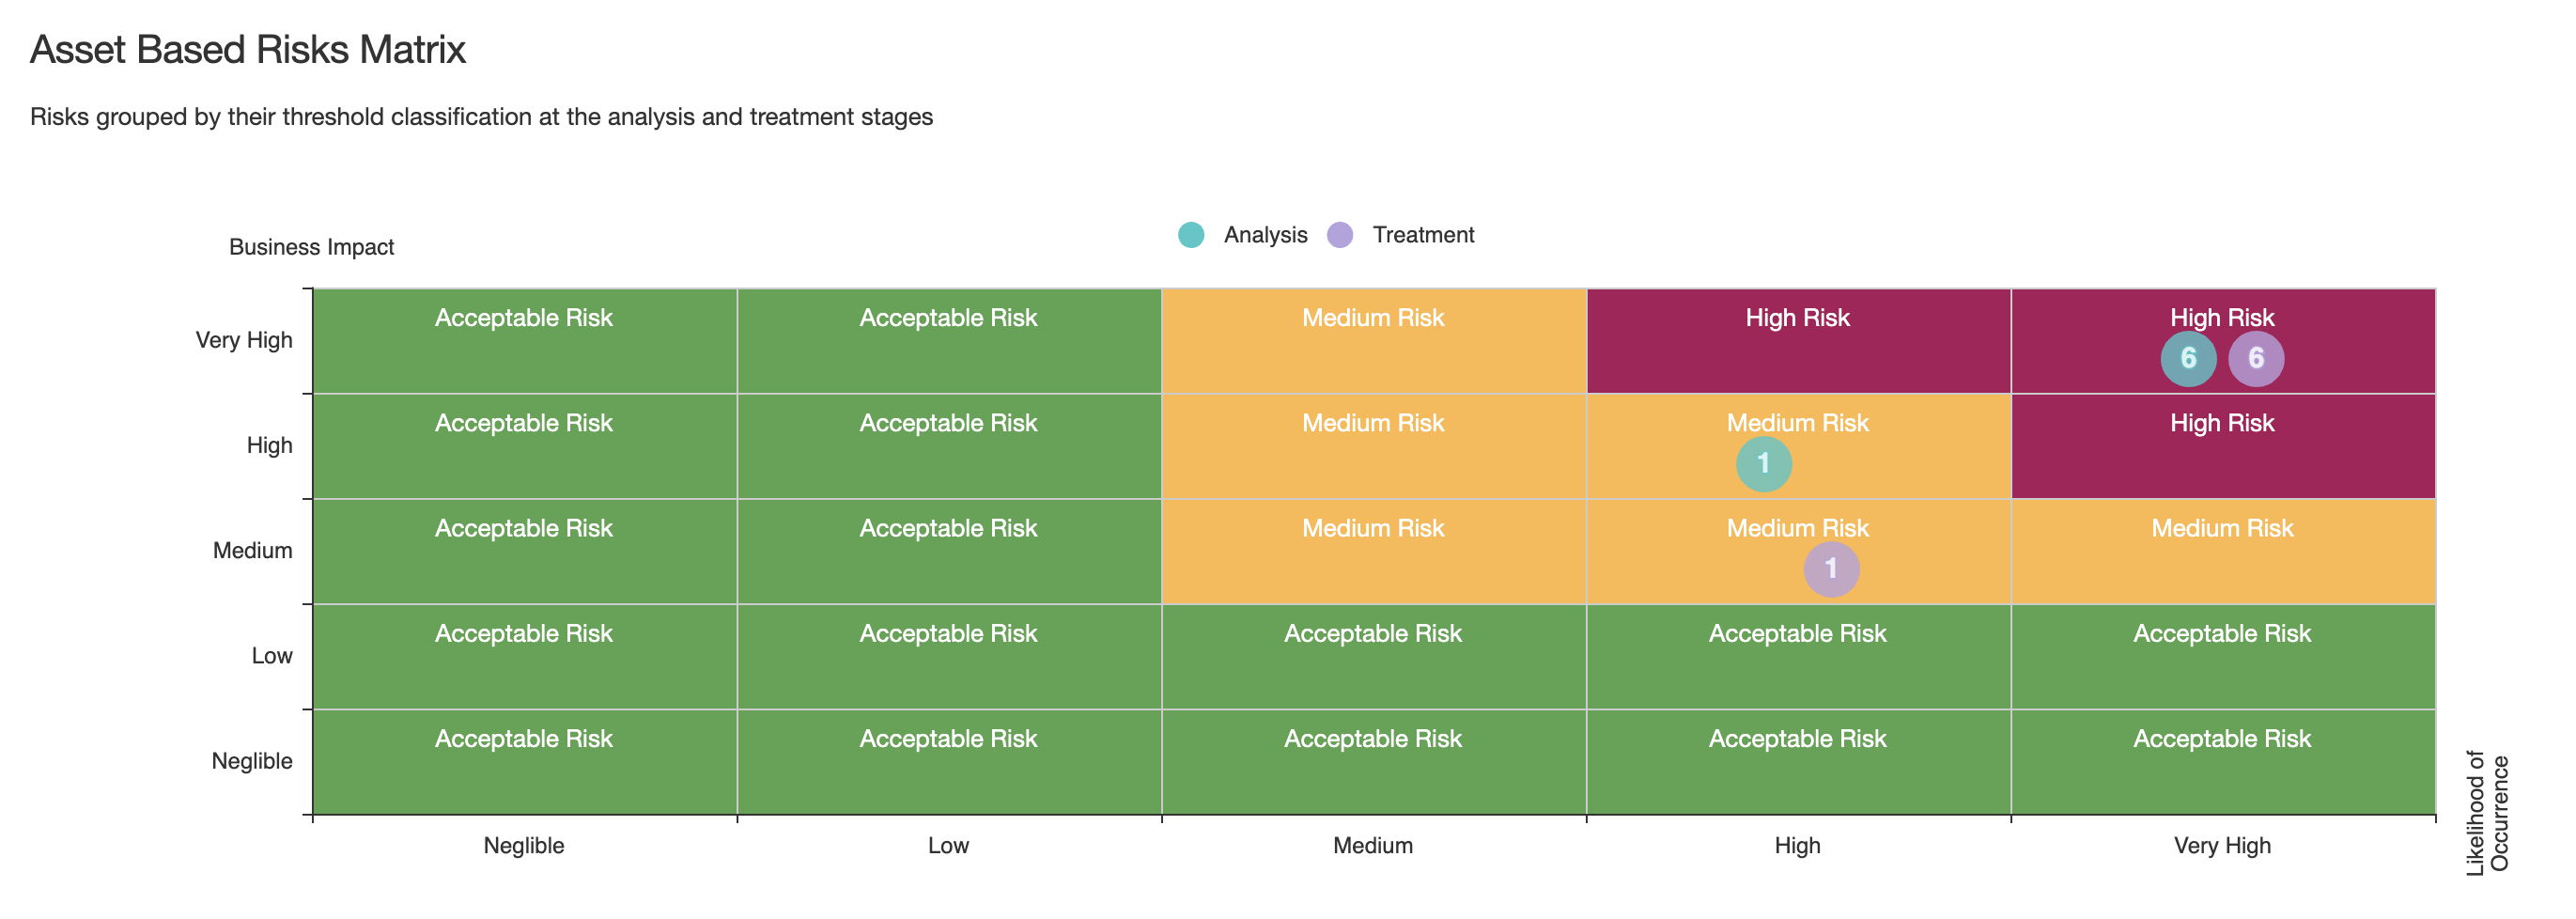
In every module in the software, you will also find pre-defined charts (you can not change the way they look or how they are calculated). In total, there are some 250 charts available to you. These charts do not show trajectories (as the ones explained above) but instead snapshot data points.
BI Tools
Reports can be made in eramba in three ways:
- Using Eramba-built reports
- Export data in CSV and use spreadsheets, etc
- BI Tools
If you are interested in using BI tools you can get data from eramba directly from the database (only read queries are allowed) or using built-in APIs.
Conclusion
For every use case, you have chosen in the first step of the implementation process you now know what modules will be used. You can then explore what charts are available on each one of these modules and start building your custom graphical reports.
You can also adjust the default landing dashboard in eramba to show data that relates to your use case alone (the default landing dashboard shows charts from multiple modules that might not be in your scope).