Template Settings
Widget used to make up Reports
Introduction
In this episode, we explain in detail what components (widgets) a template can include and how they can be manipulated in order to create a template.
Template Builder
The report builder is accessible from the menu bar under the "Report" option. Every type of report has a slightly different option to create new templates:
- Section Report: on any module, click on Report / Section / New
- Item Report: on any module, click on Report / Item / New
- Landing Dashboard: click on Settings / Dashboard / Actions / New
The builder requires you to do the following:
- Provide a name for your template
- Drag and Drop Widgets into the template
- Re-organize the widgets (up, down, right, left)
- Configure widget settings
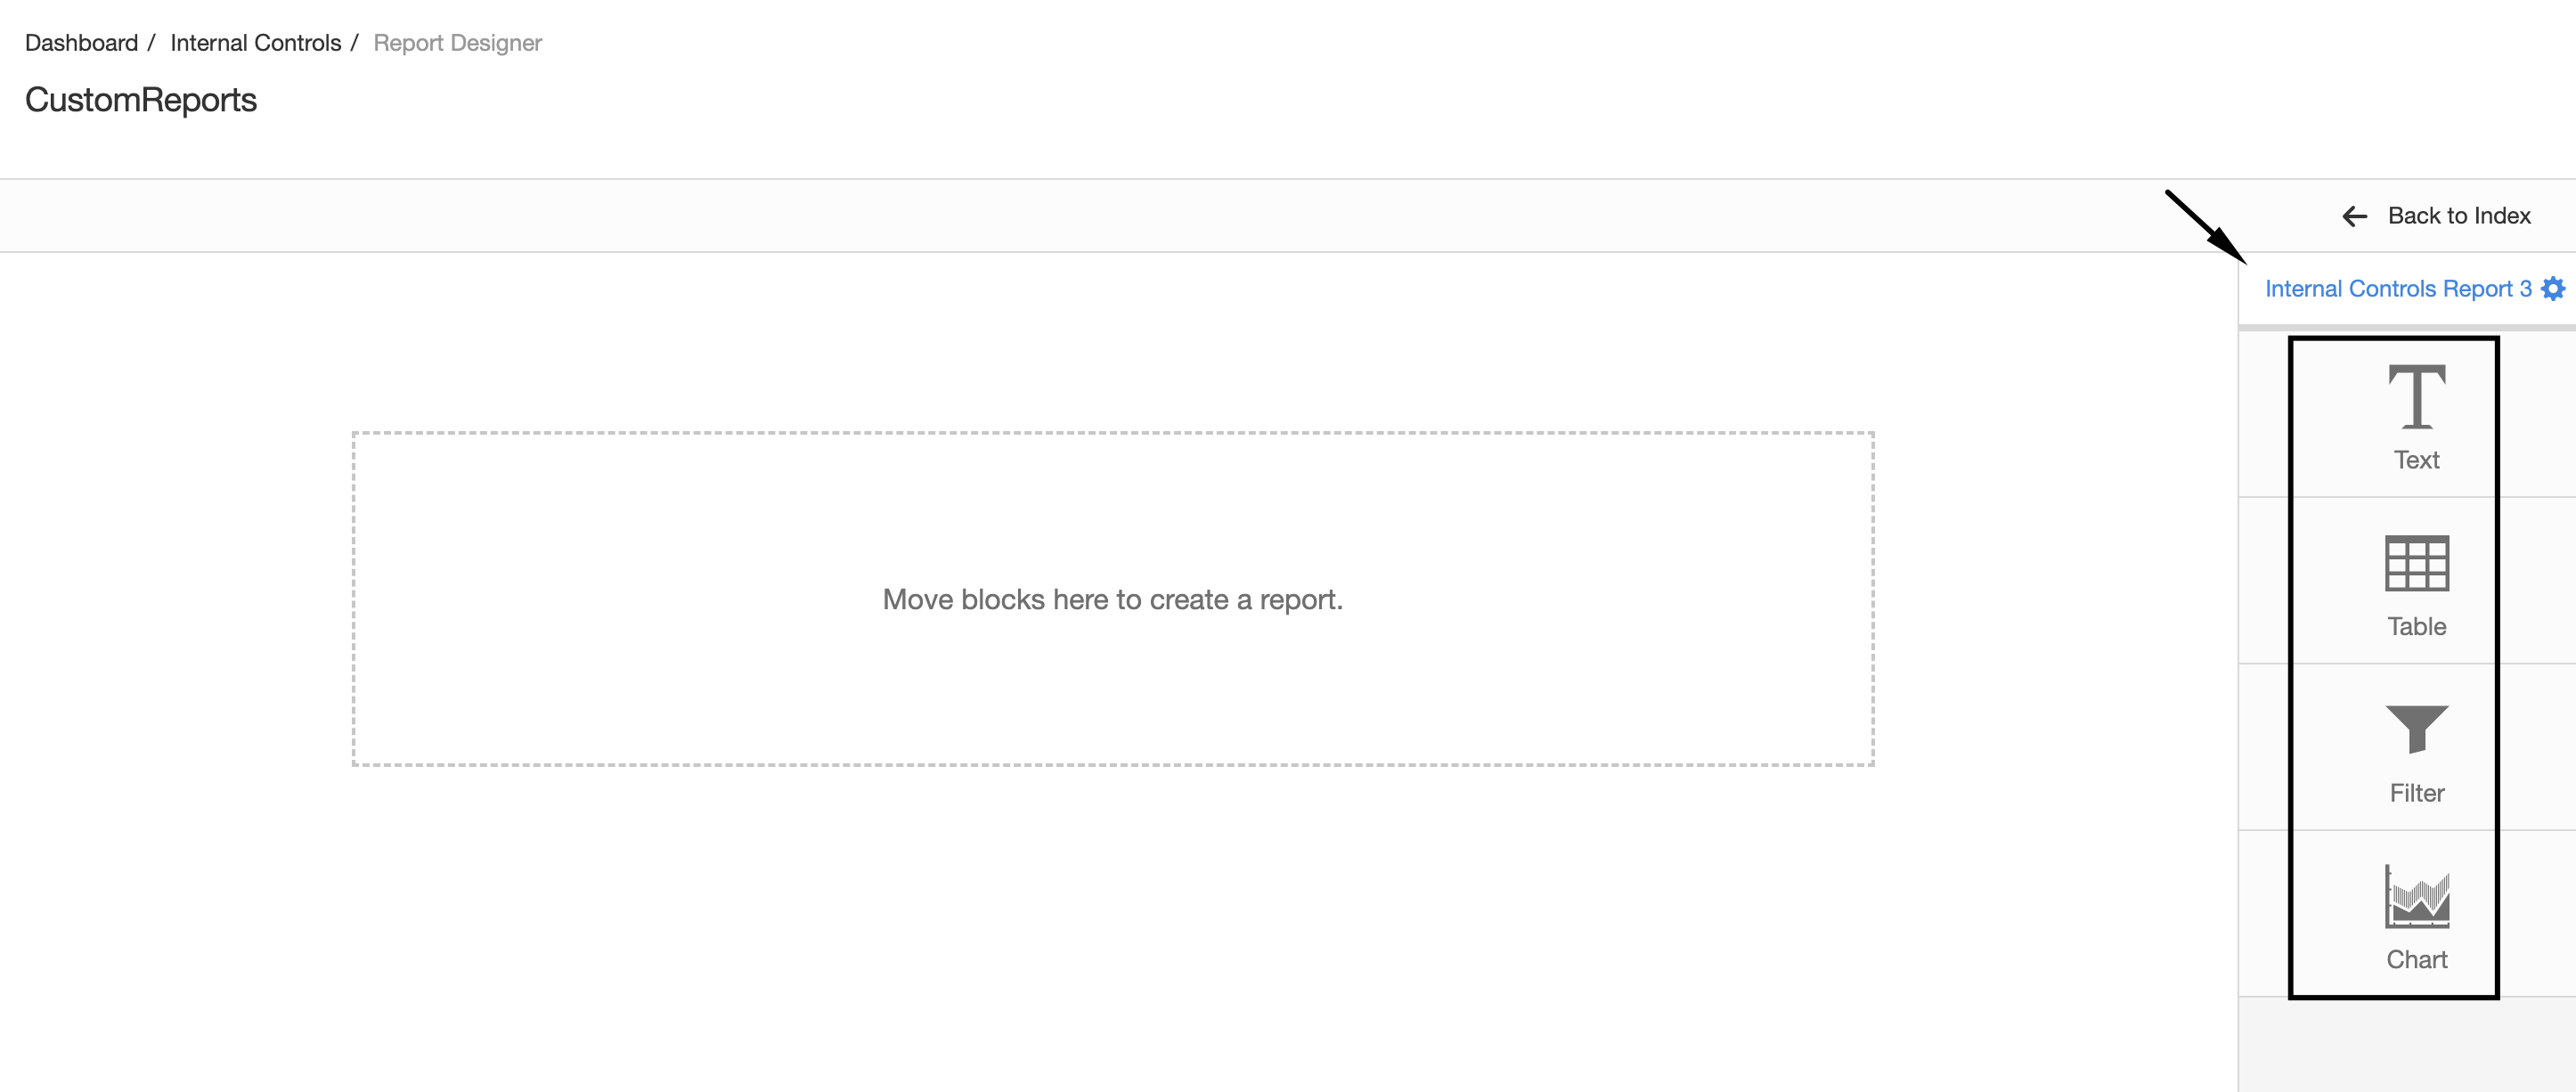
The rest of this episode focuses on the type of widgets available for your reports.
Text Widget
The text widget is available on all three types of reports and allows you to include any kind of formatted text.
In the case of "Item Reports" you can also include macros for the item attributes (title, description, etc). This feature is not possible in "Section Reports" as the report is generic to all items and not one in particular
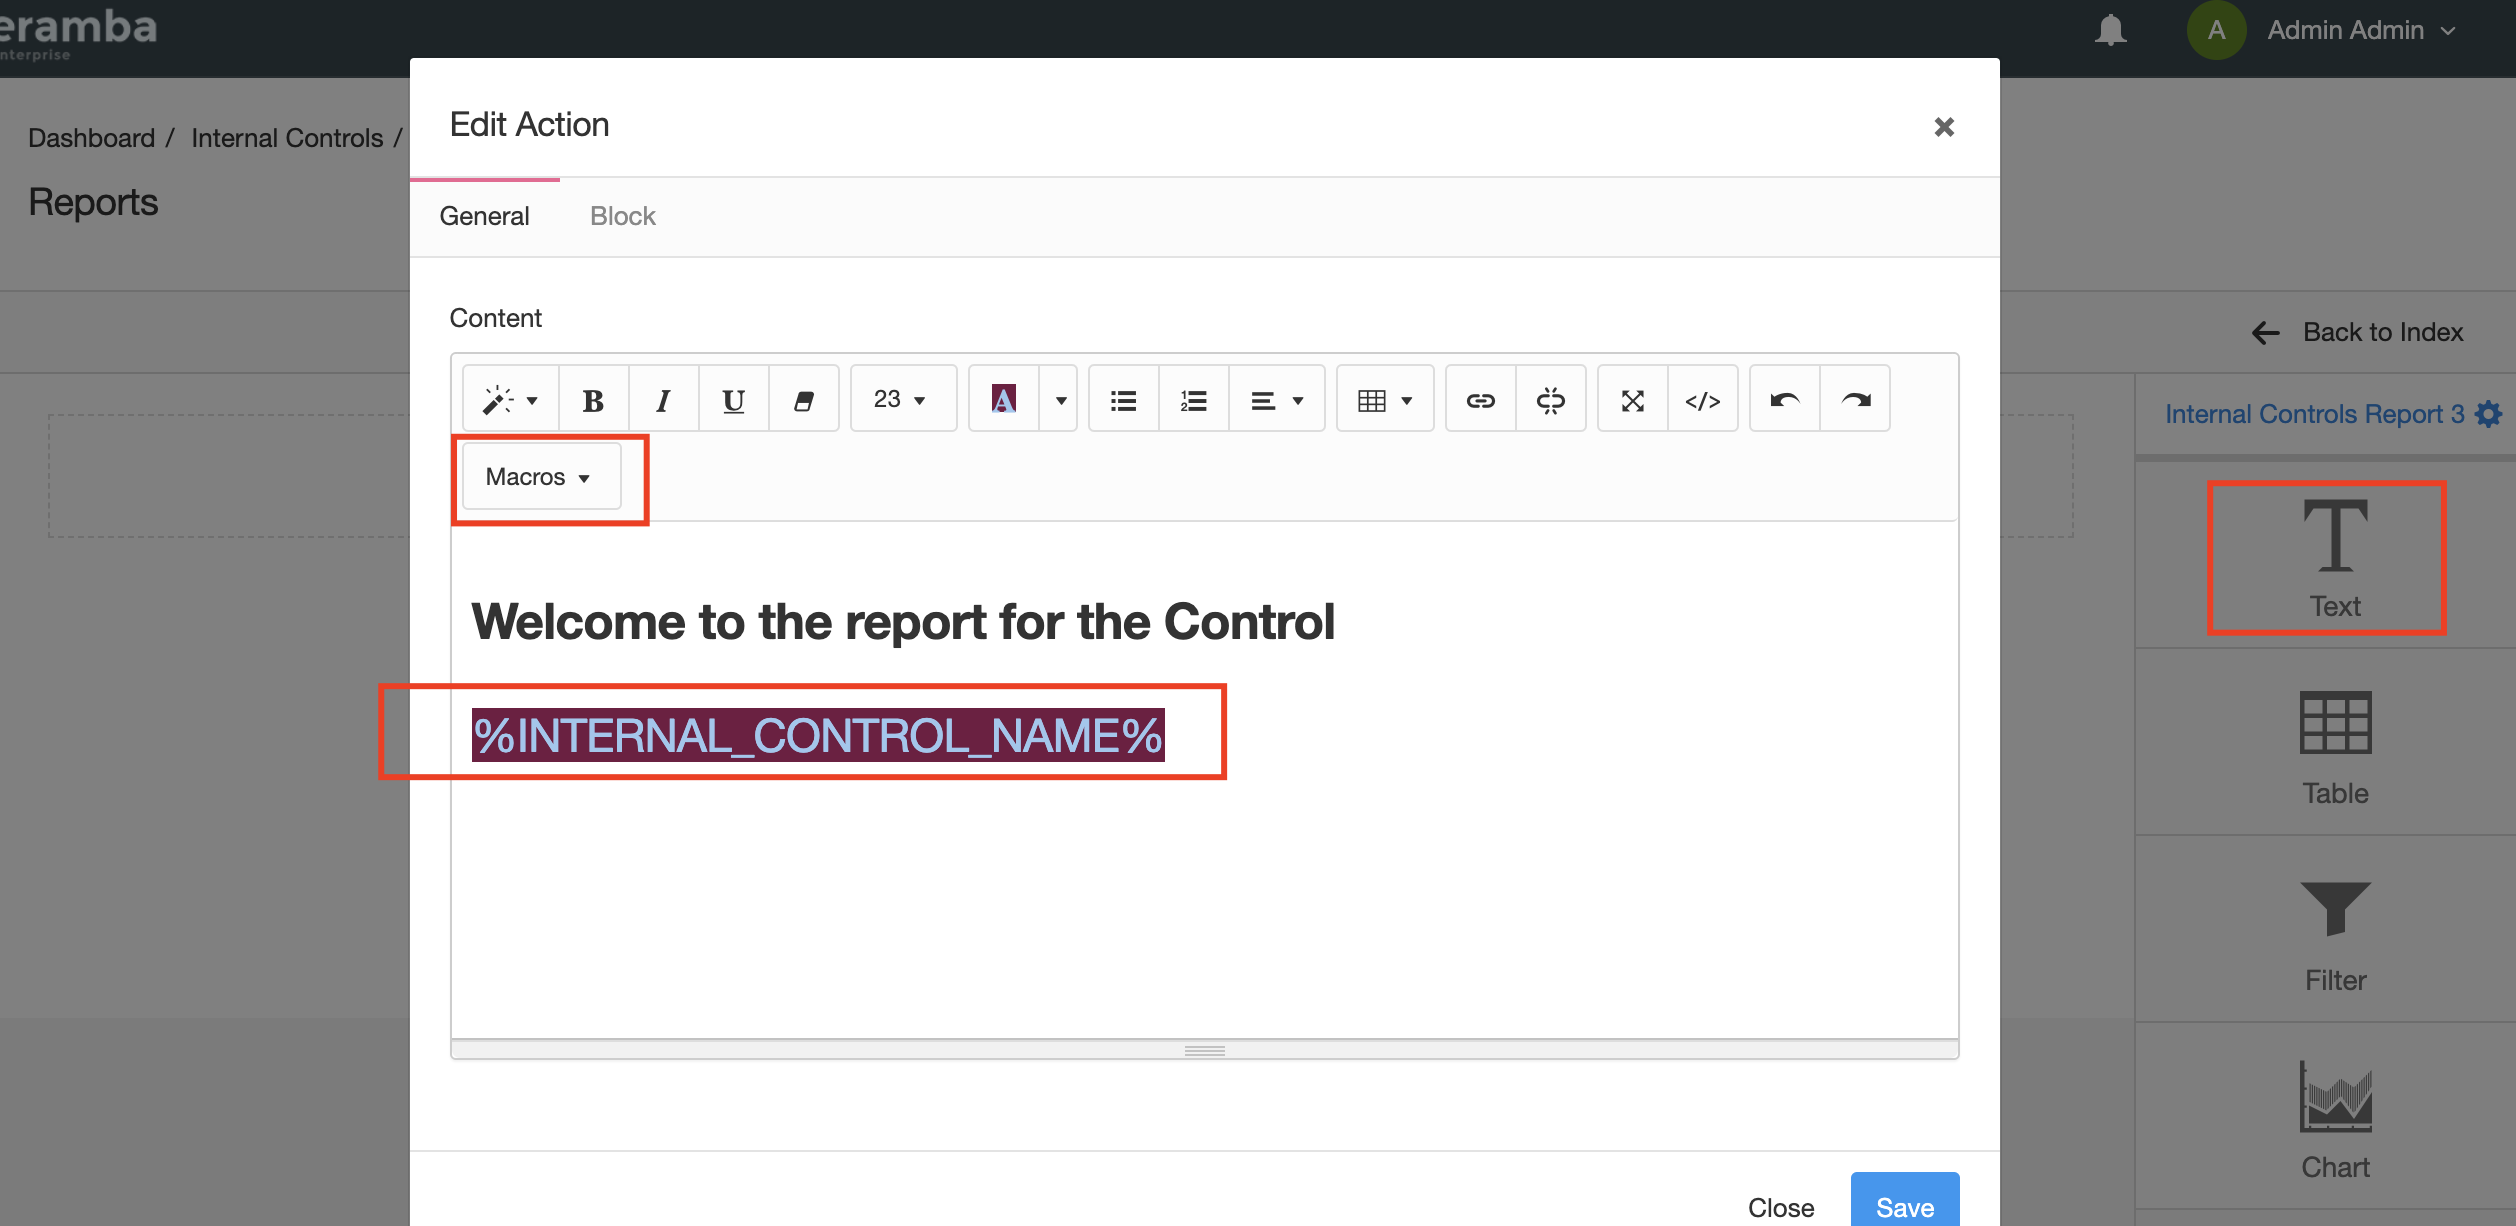
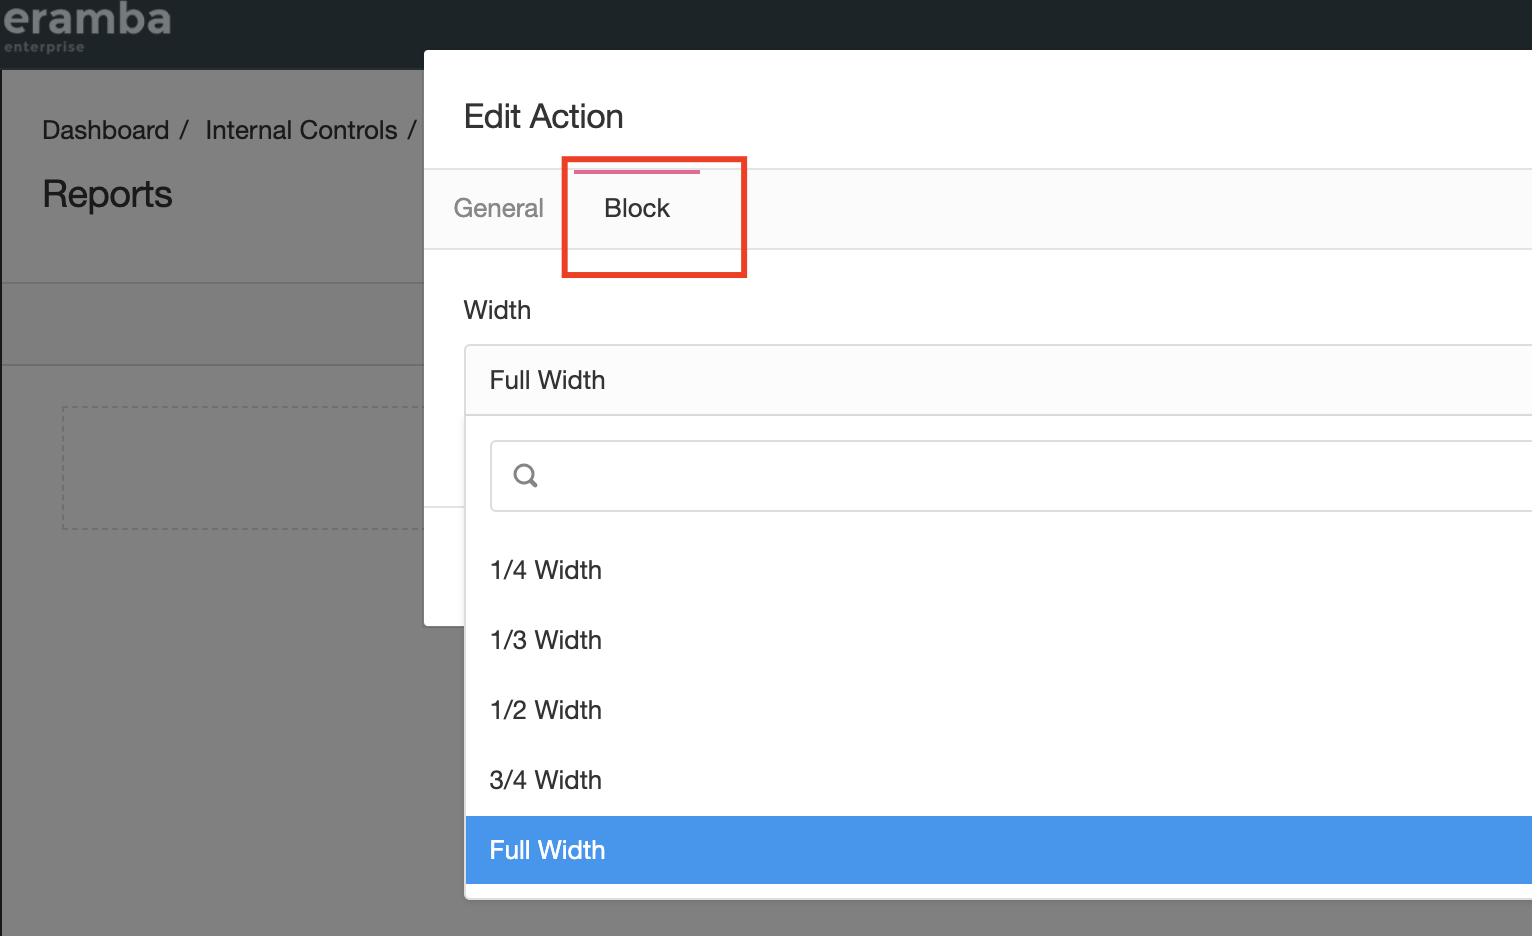
The widget can have multiple width sizes
Filter Widget
The filter widget is available on all three types of reports and allows you to include an existing filter (review Filter Course for details) in the report.
You need to select the filter you want to display (is useful to configure your filters with a "Limit" option to list for example your "Top 10 Risks" in a report).
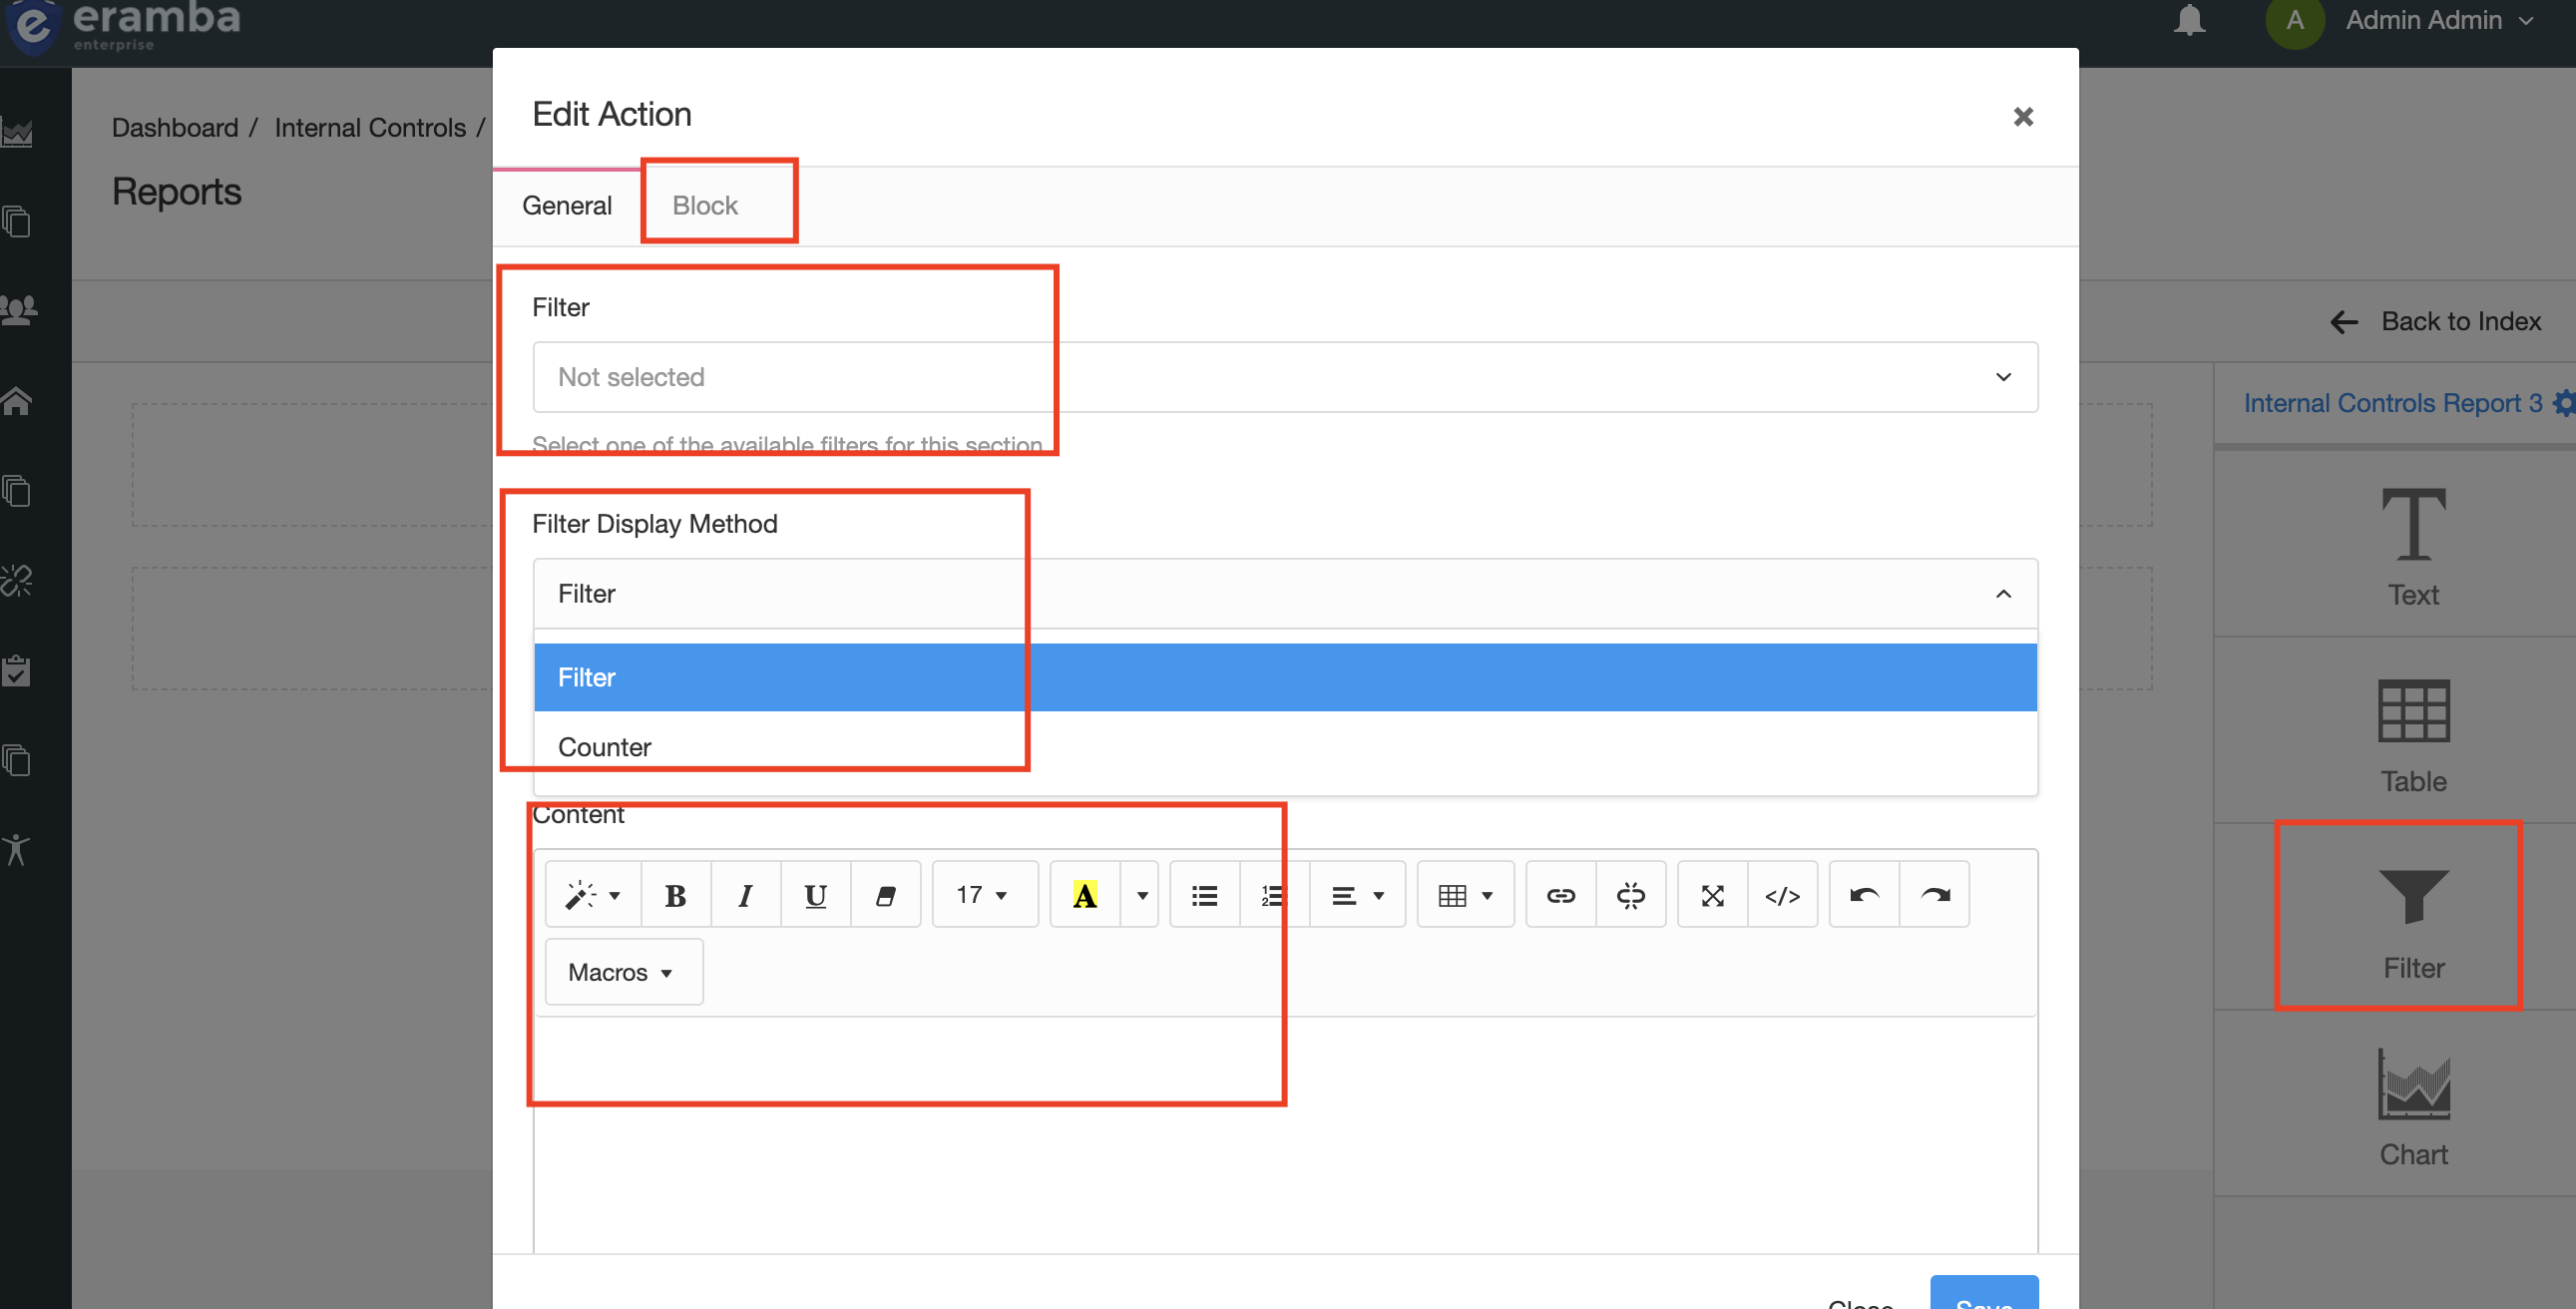
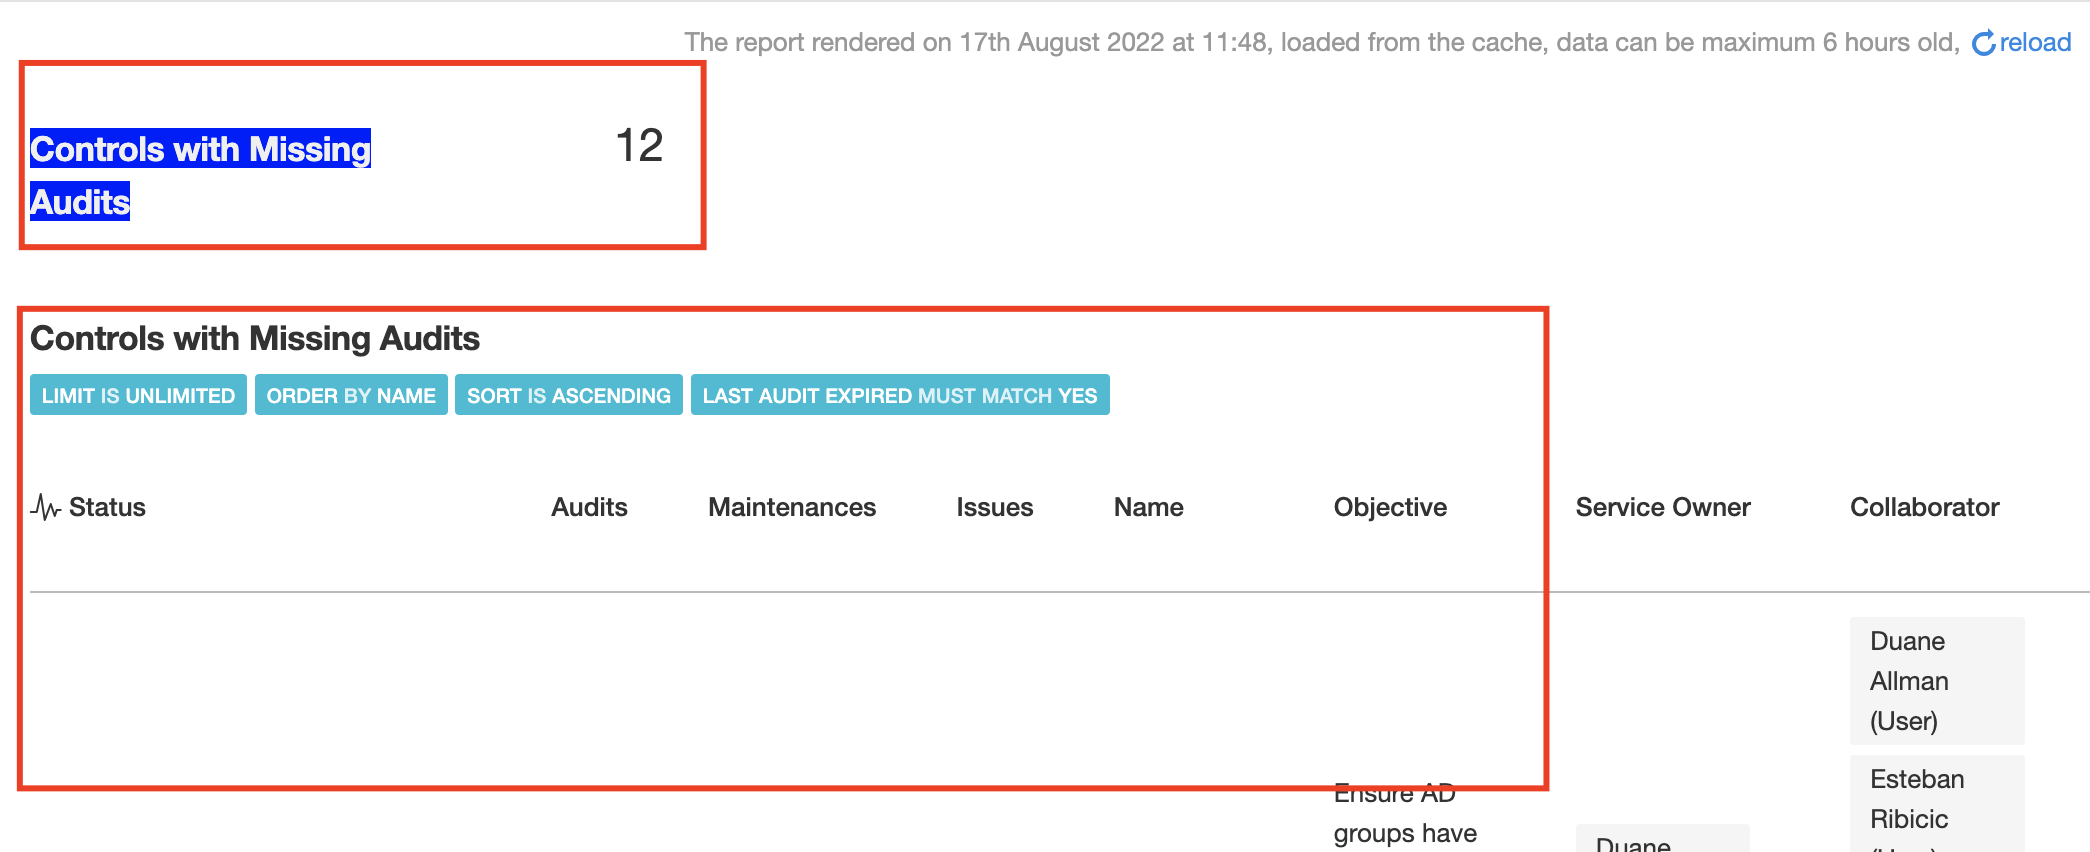
You also need to configure if you want to see the full list of items as the filter would show or just the counter of items. Either way, you can include any text you want in the widget.
Table
The table widget is only available on the "Item Report" and is used to describe an item in detail.
You need to select from which tab (if the module you are in has more than one tab) you want to pick up the item fields, what fields you want to show, in which order you want to show them and some text on the widget (including macros).
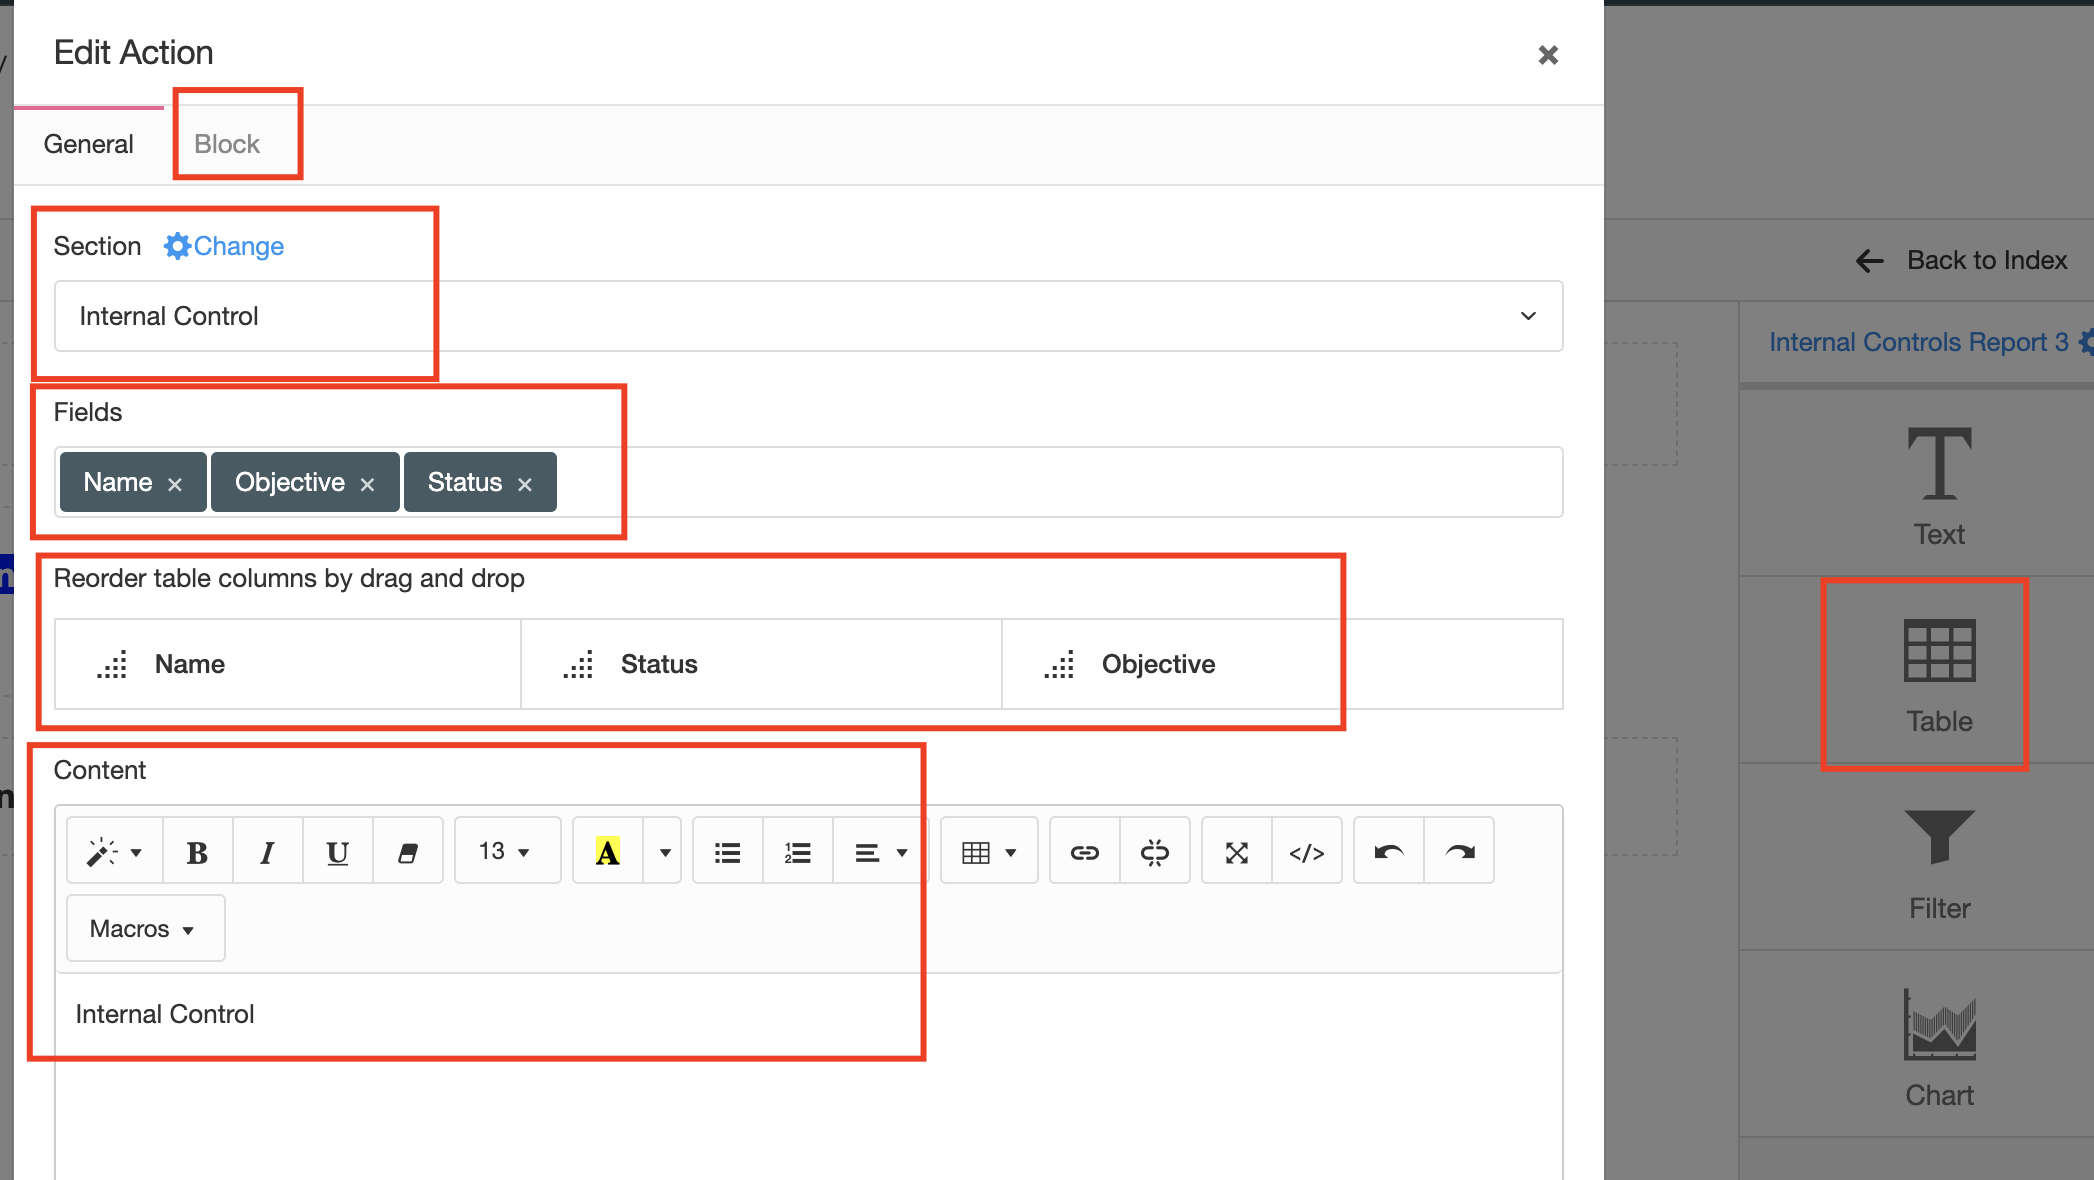
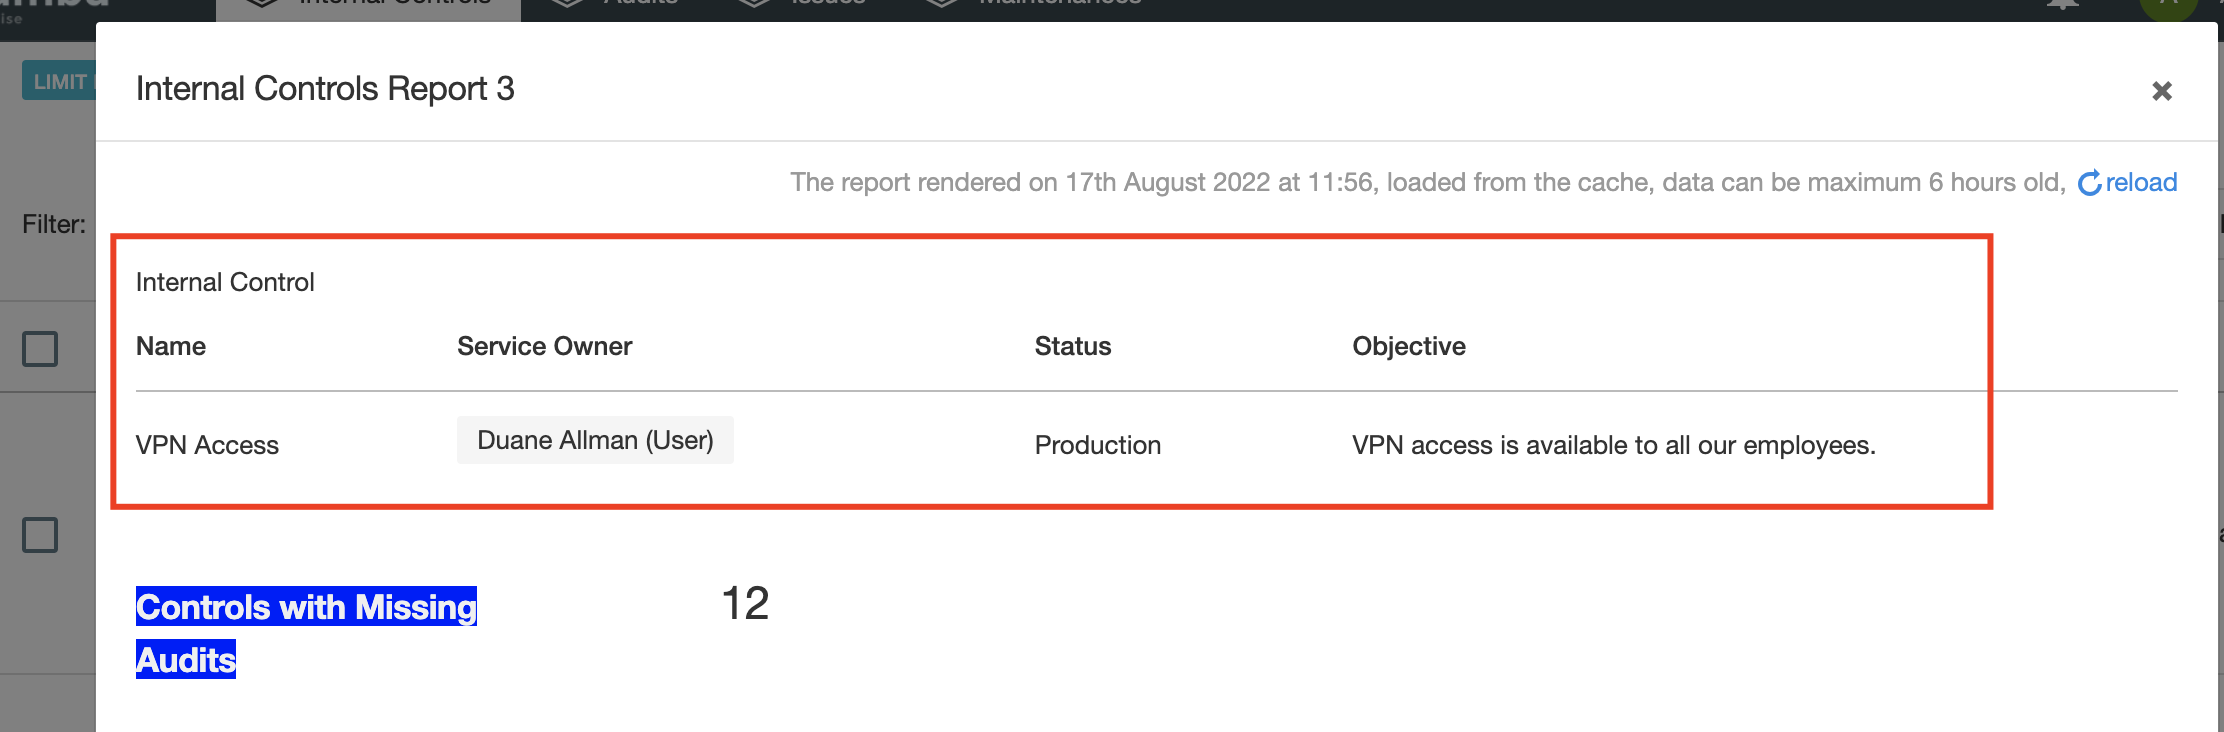
If you are on a section with more than one tab, for example Policy module you can show the table for the policy and a second table for its reviews (just make sure you change the table on the widget to Reviews). The table once loaded looks as the screenshot below.
Task Widget
The task widget is only available on the "Landing Dashboard" report and shows items (Risk Reviews, Projects, Tasks, Audits, etc.) based on their deadline.
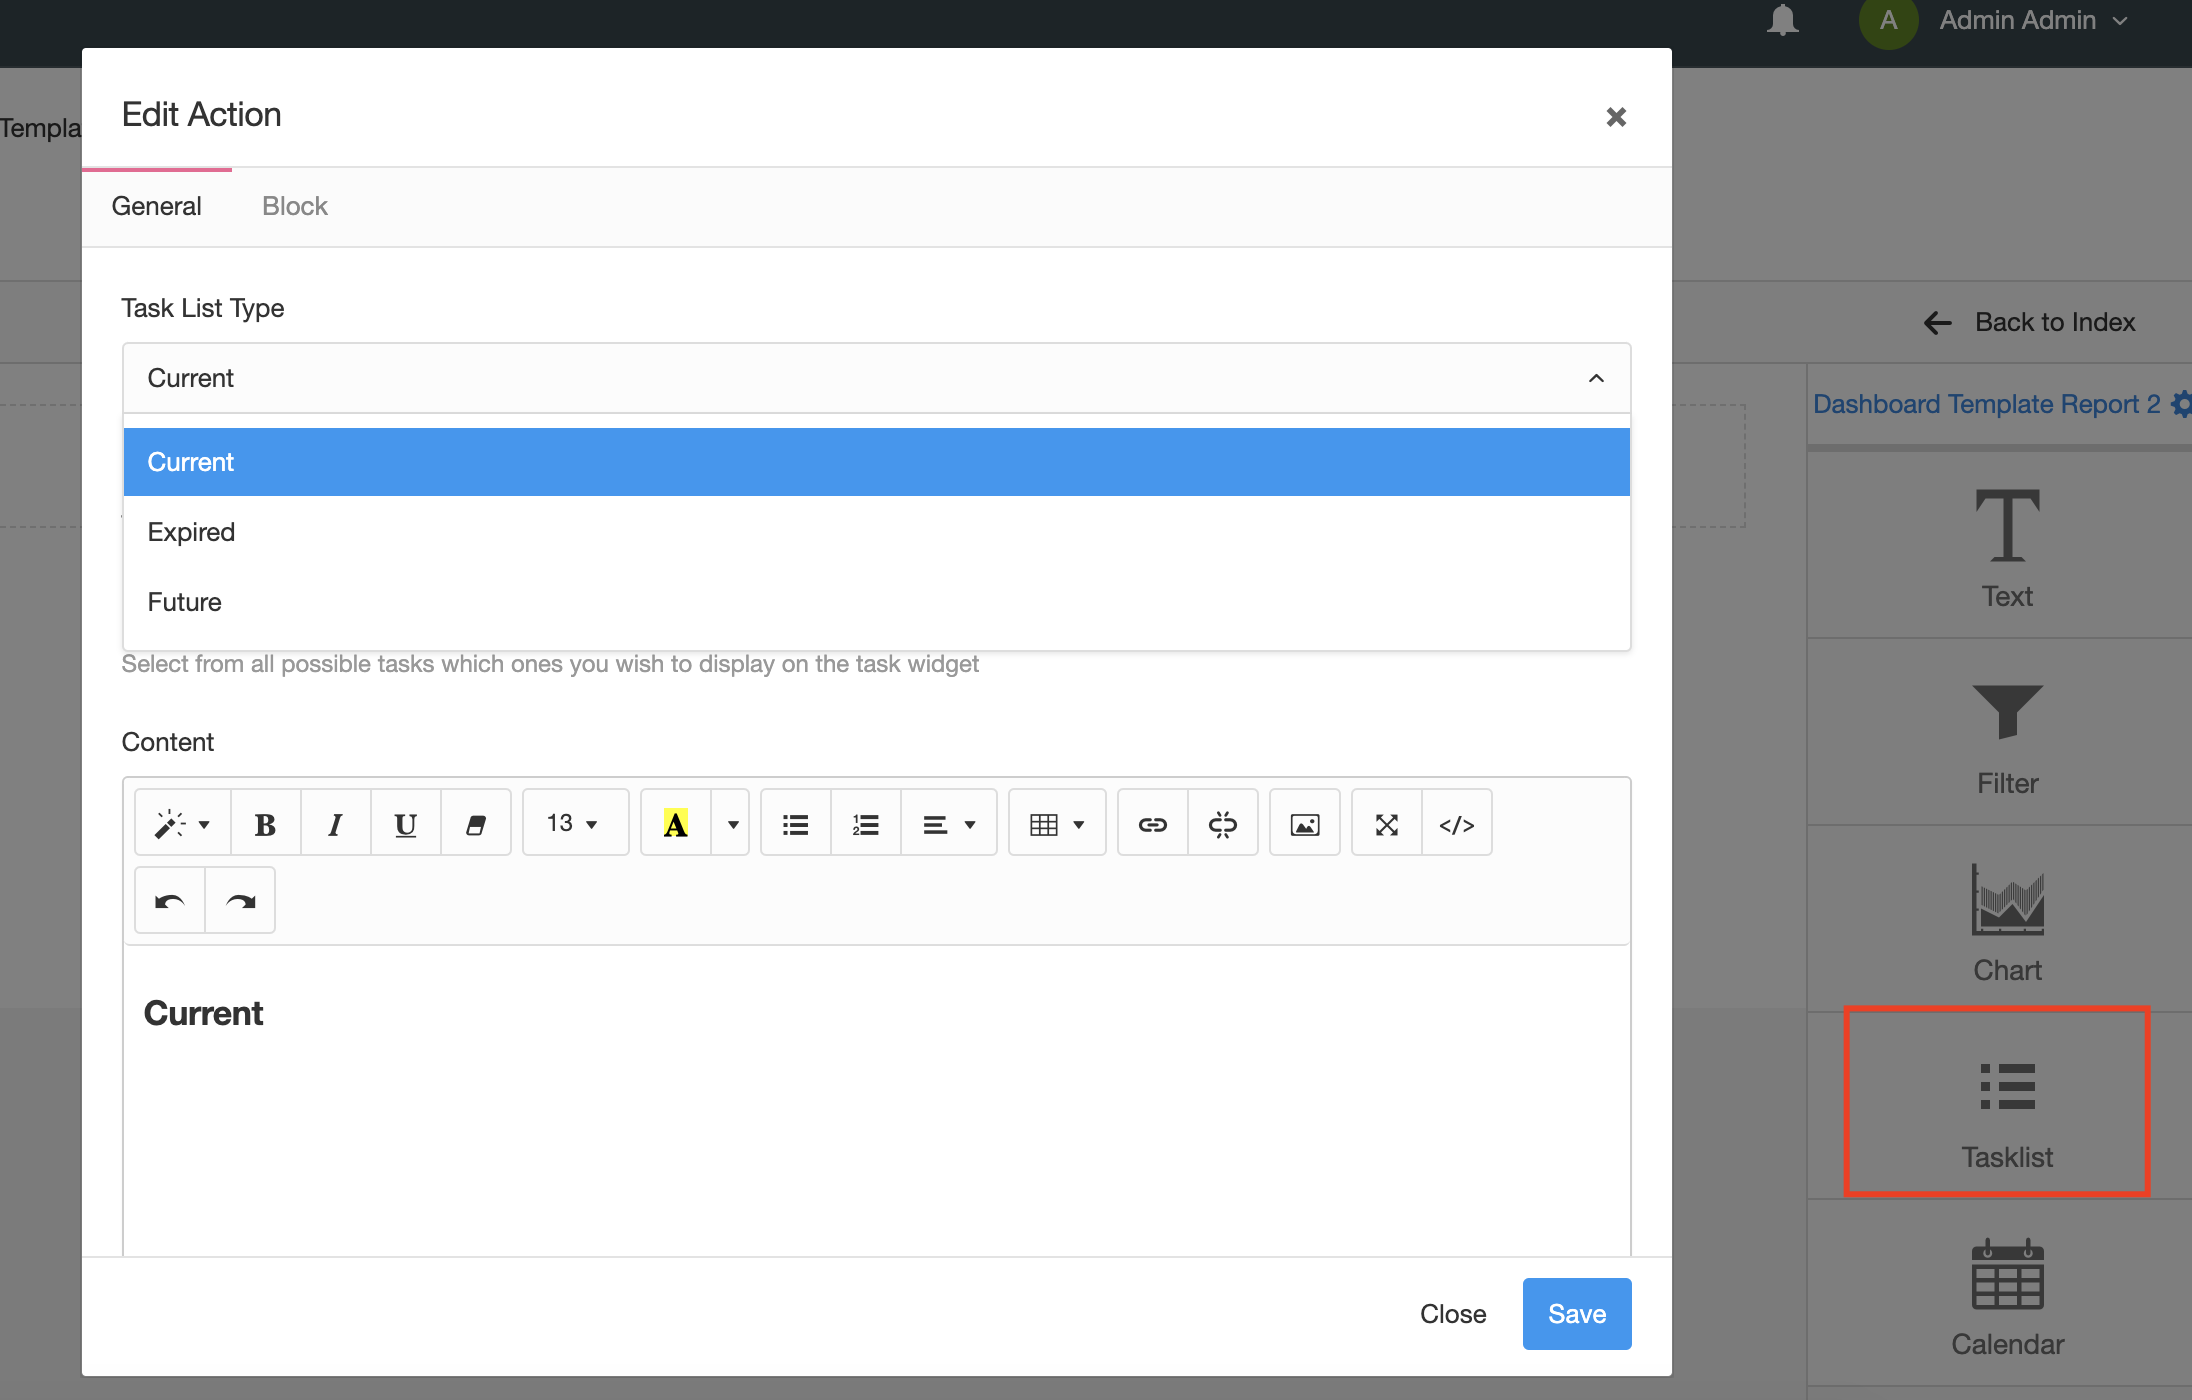
You need to select which type of deadline you want to show (Past, Current or Future) and then which items (Risks, Projects, etc.). Typically you can fit all three deadlines in one row by making the block size to 1/3 of the screen.
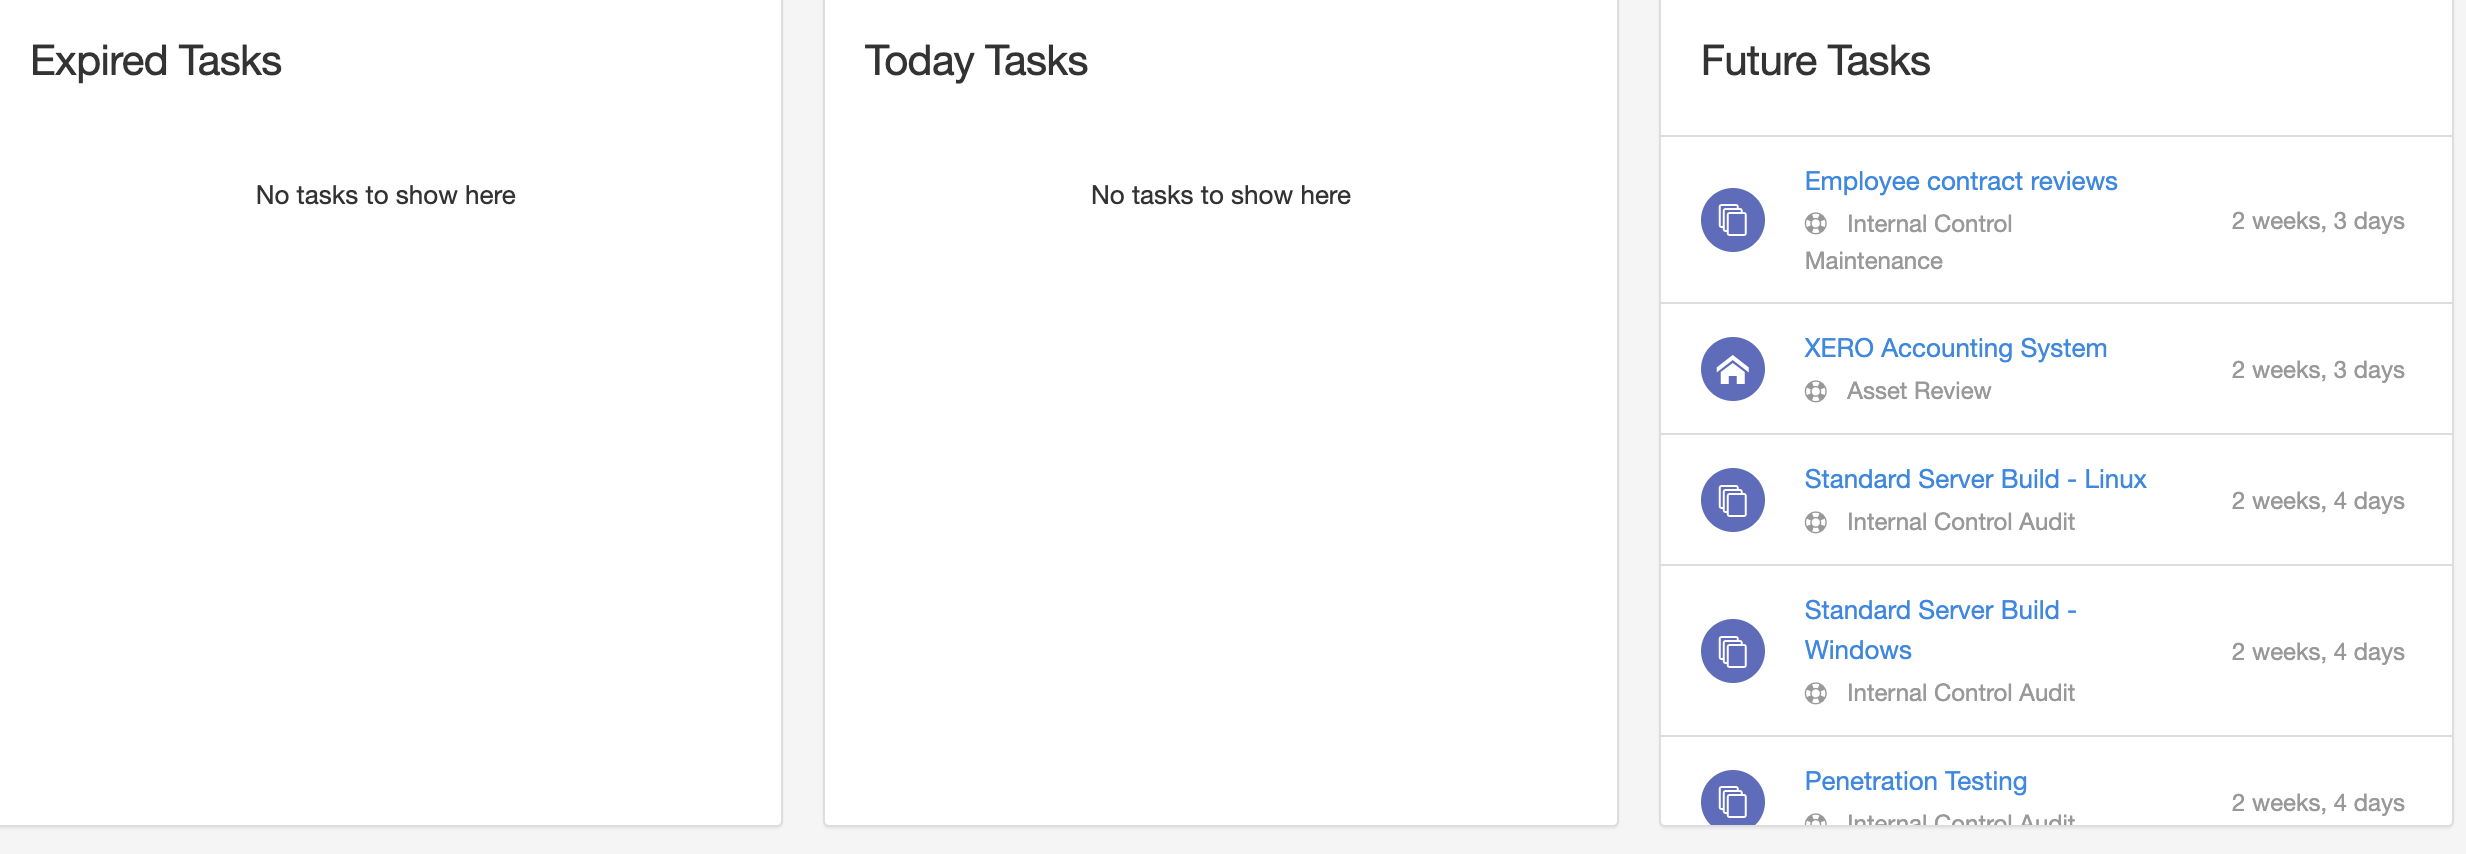
Chart Widget
The chart widget is available on all types of reports and is made of multiple charts (pie, overtime, vertical bars, risk matrix, etc).
These are hard-coded charts - you can not modify them in terms of how they are calculated or what colours or types of charts they use.
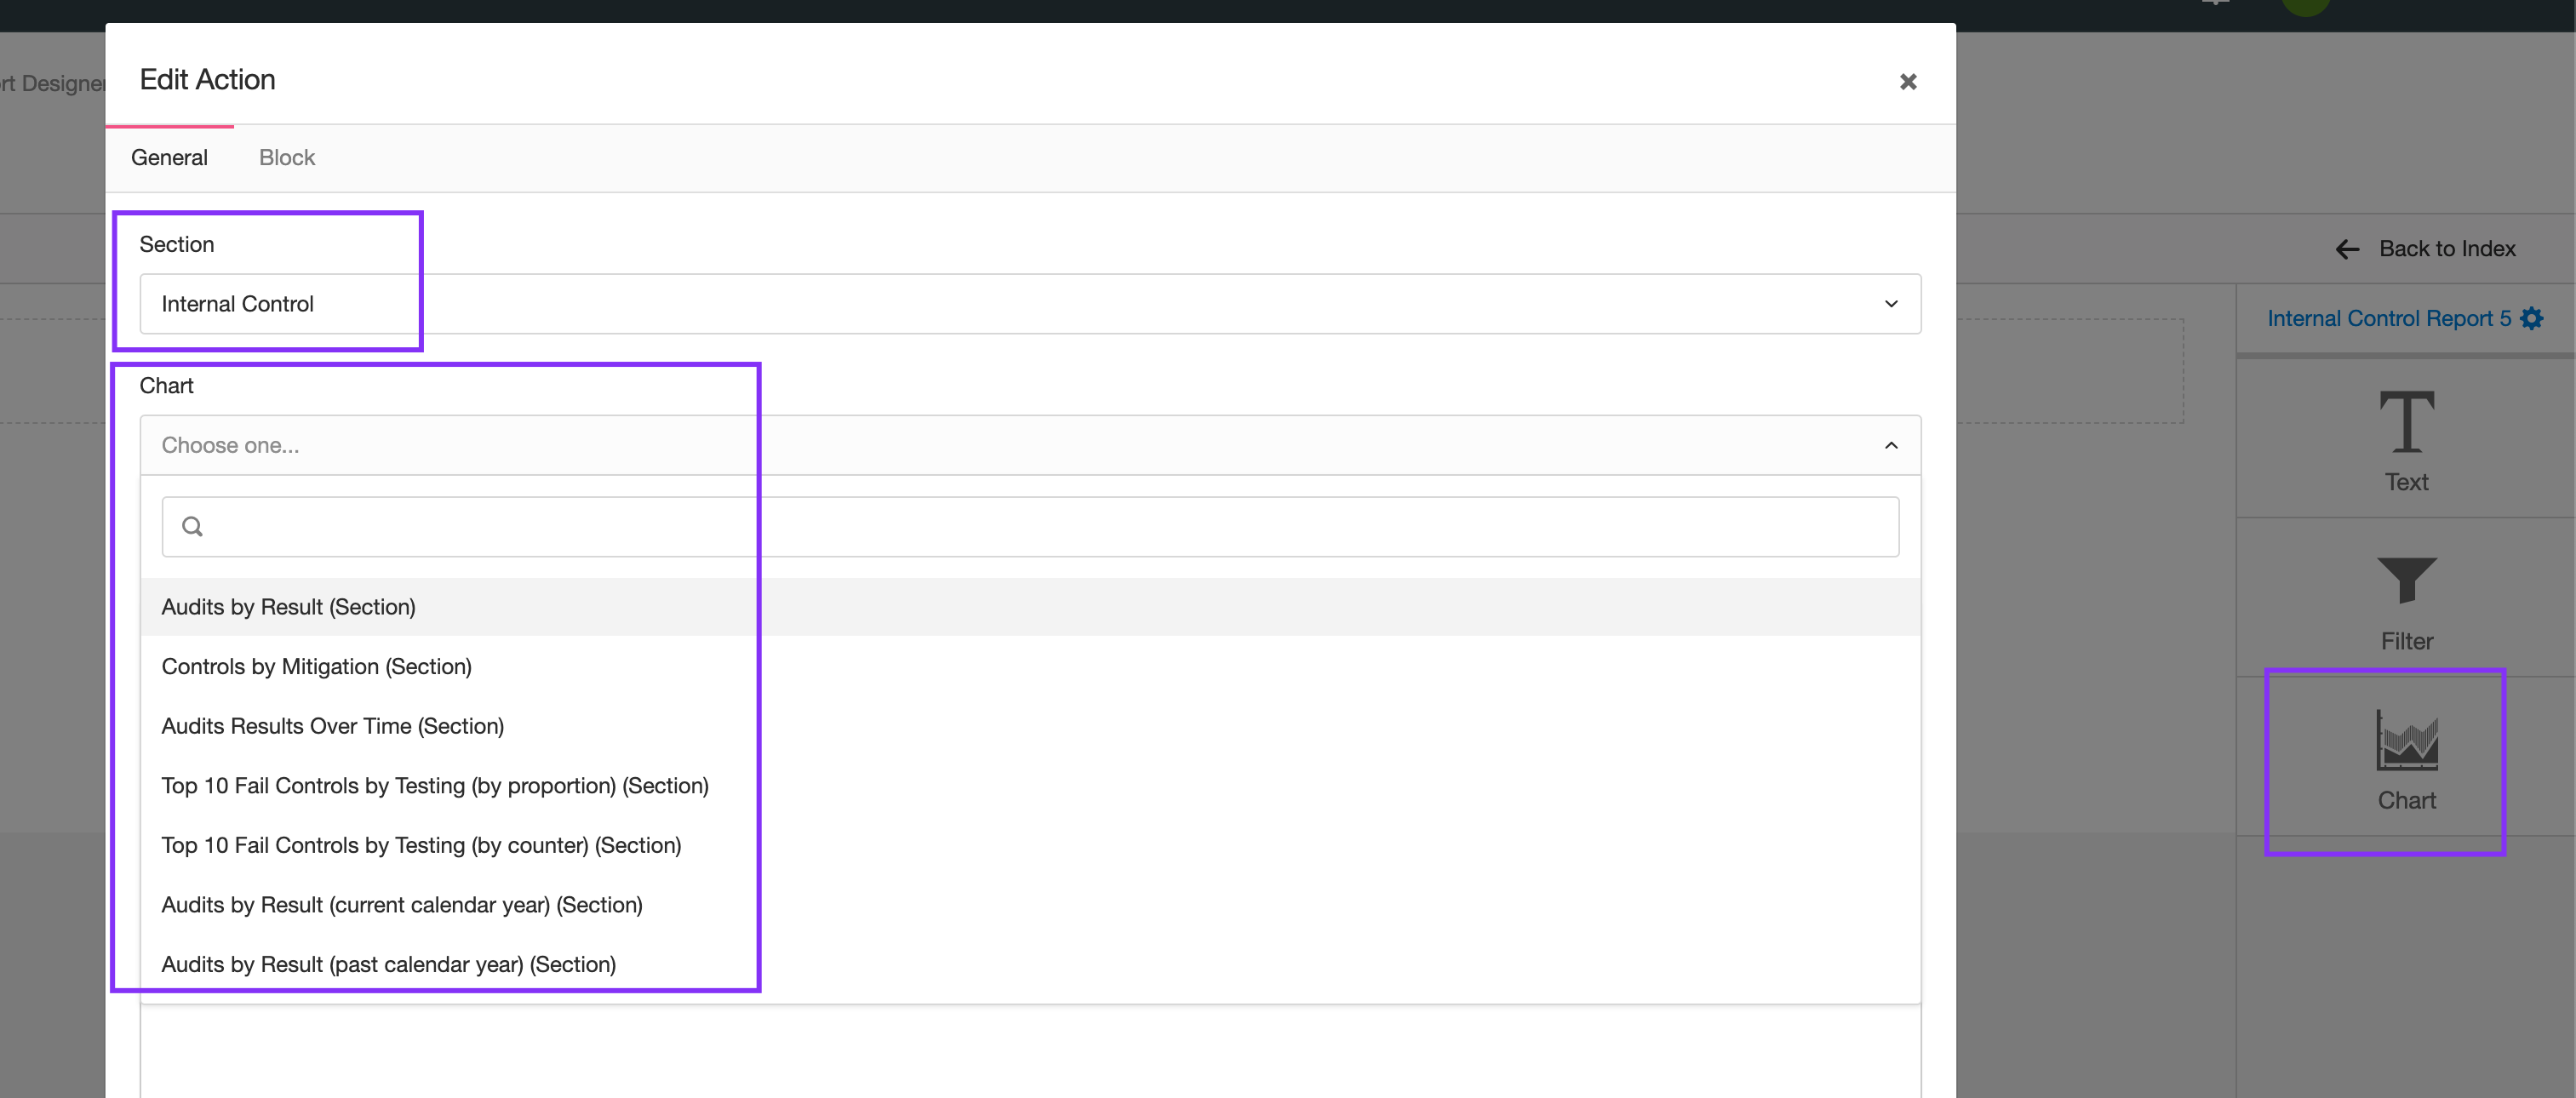
When you drag and drop the chart widget into the report you need to select the section from which you want the chart to originate (by default you will be shown the charts for the section you are located) and then the type of chart.
This means that you can, for example, use a chart from the Internal Control module even if you are working in the Risk module.
If you are building a Section report you will only be shown a "Section" type of charts, if you are building an Item report you will see both "Item" and "Section" charts. This is because some charts are designed to show data from a single item rather than from a collection of items.
Once you drag and drop the chart and select a chart you can adjust the text and block size.
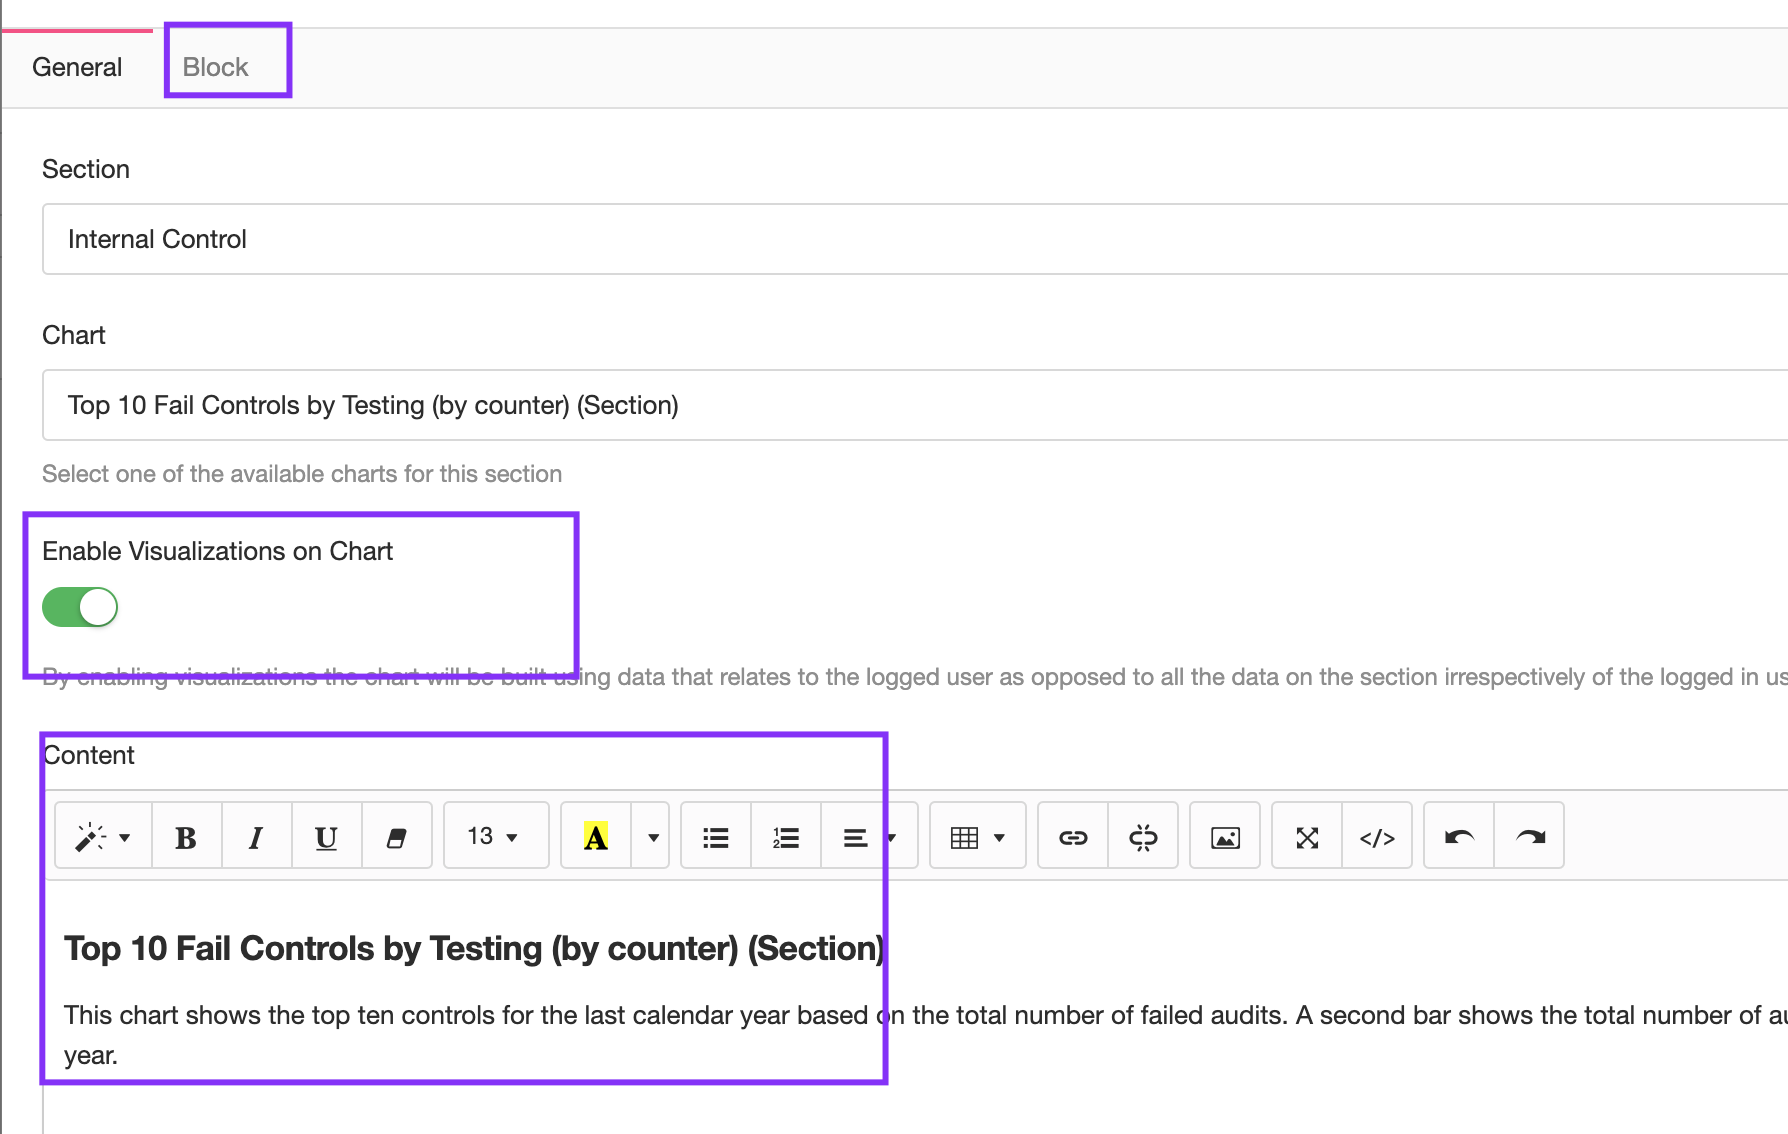
Visualisation settings will affect what users will see on these charts (review visualisation concepts), if you would like to avoid visualisation from taking effect you can disable the toggle and everyone (no matter who logs in) will see the same charts based on all data on the system.
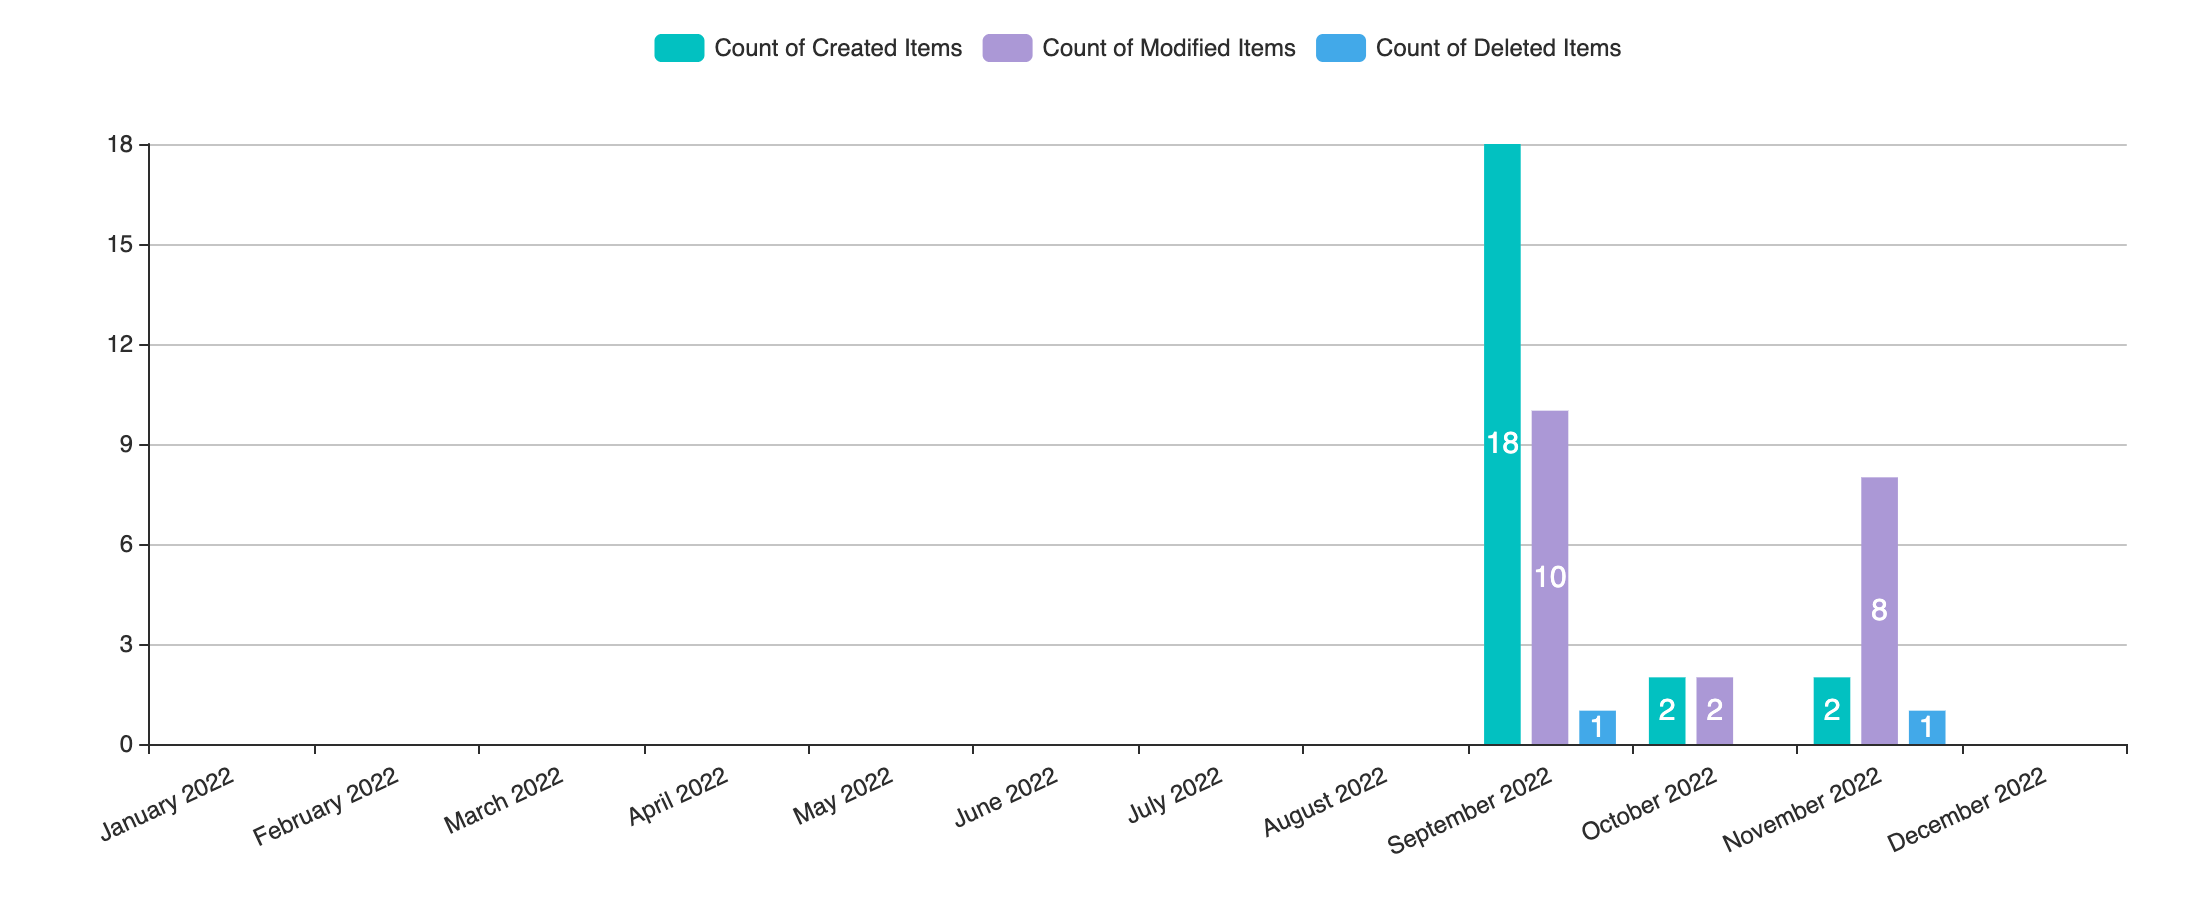
System Charts
eramba includes "System Charts" in all modules, these charts do the same thing no matter in which module you are.
CRUD Charts show with vertical bars, how many items where created, deleted and modified per month.
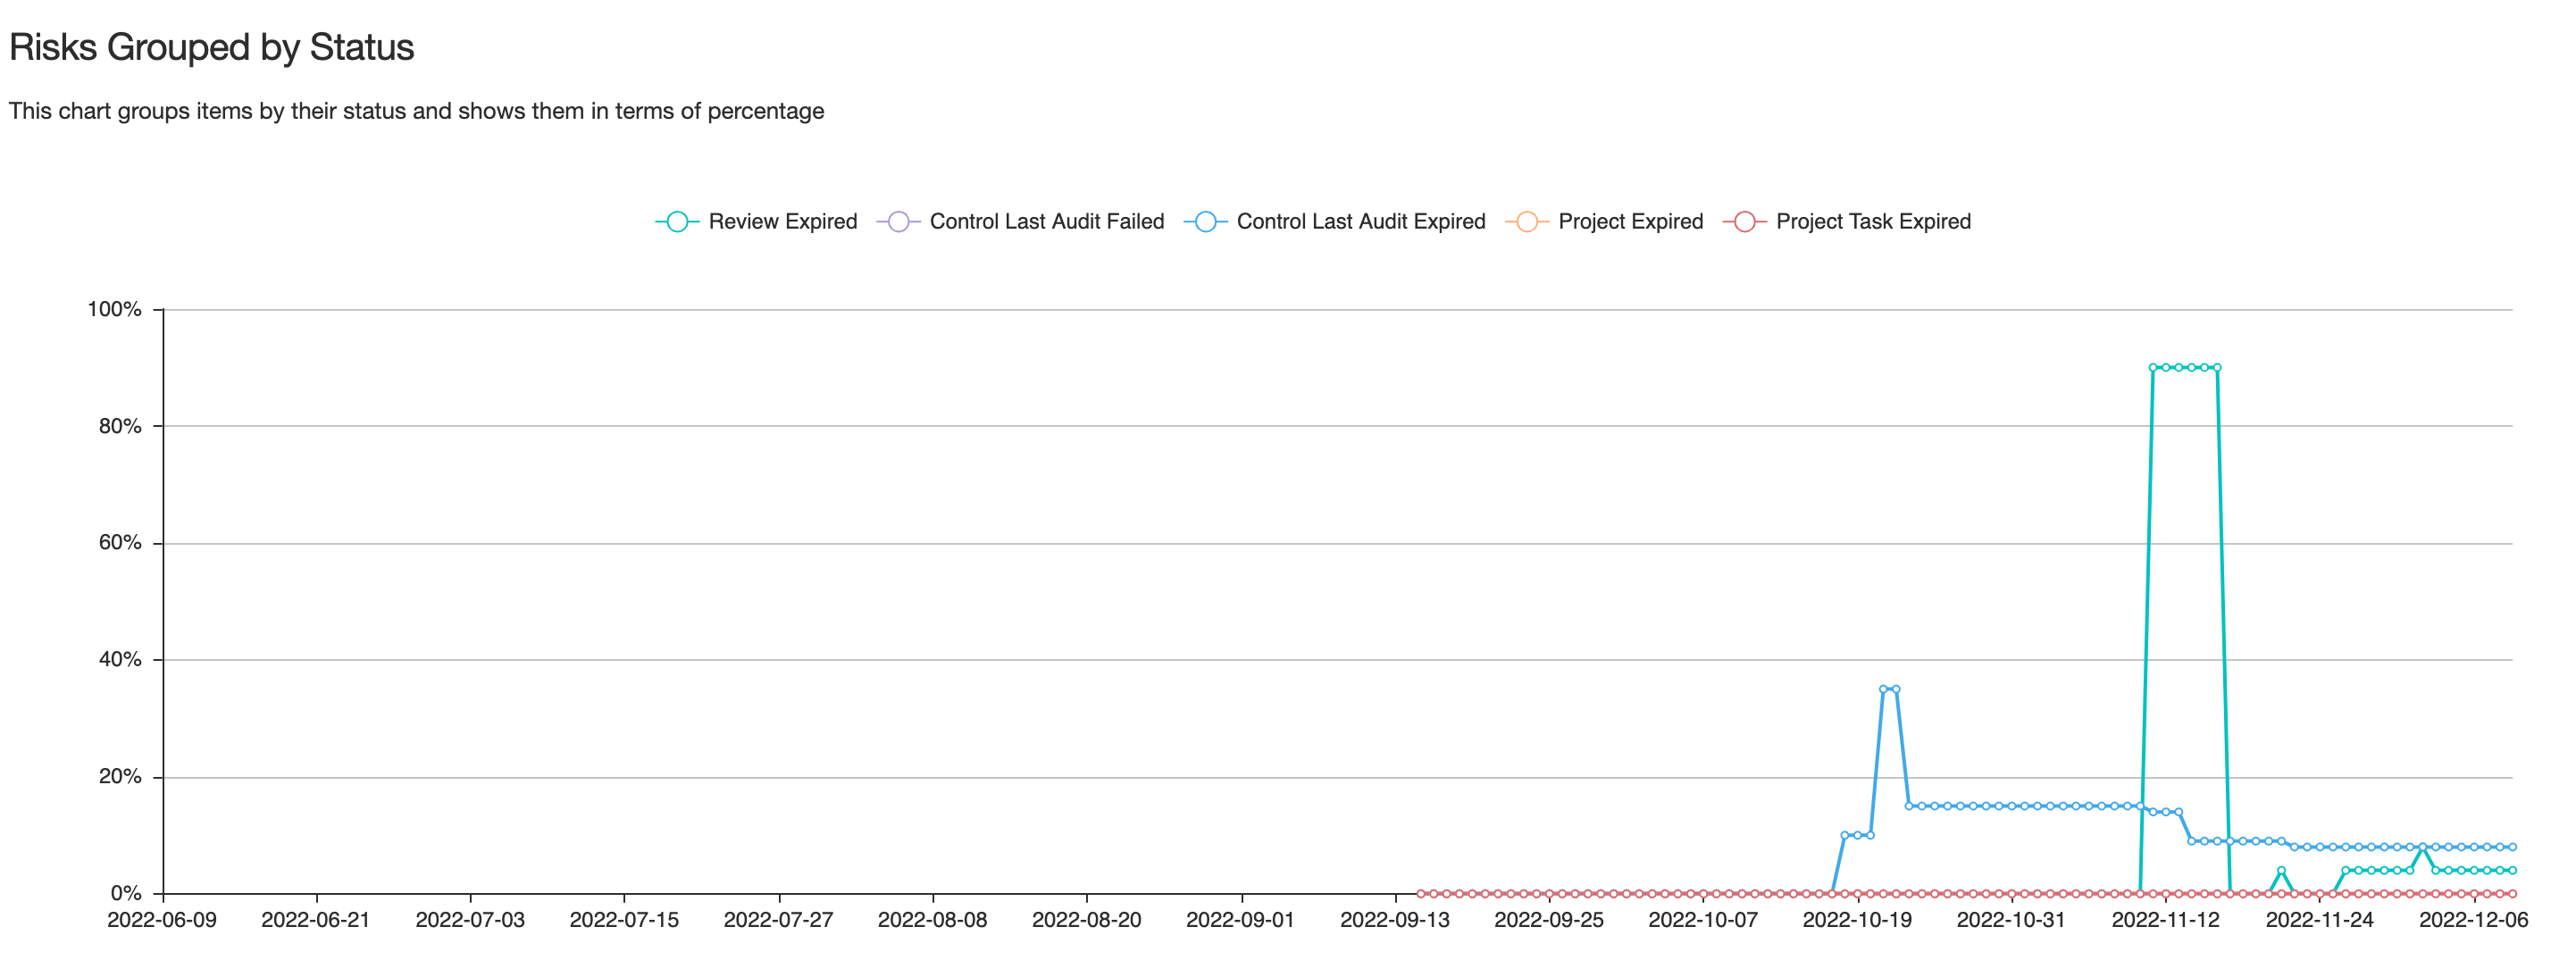
Status by Group charts show an overtime chart grouped by the statuses from that section. You can configure this chart to tell what Statuses you wish to see on the chart.