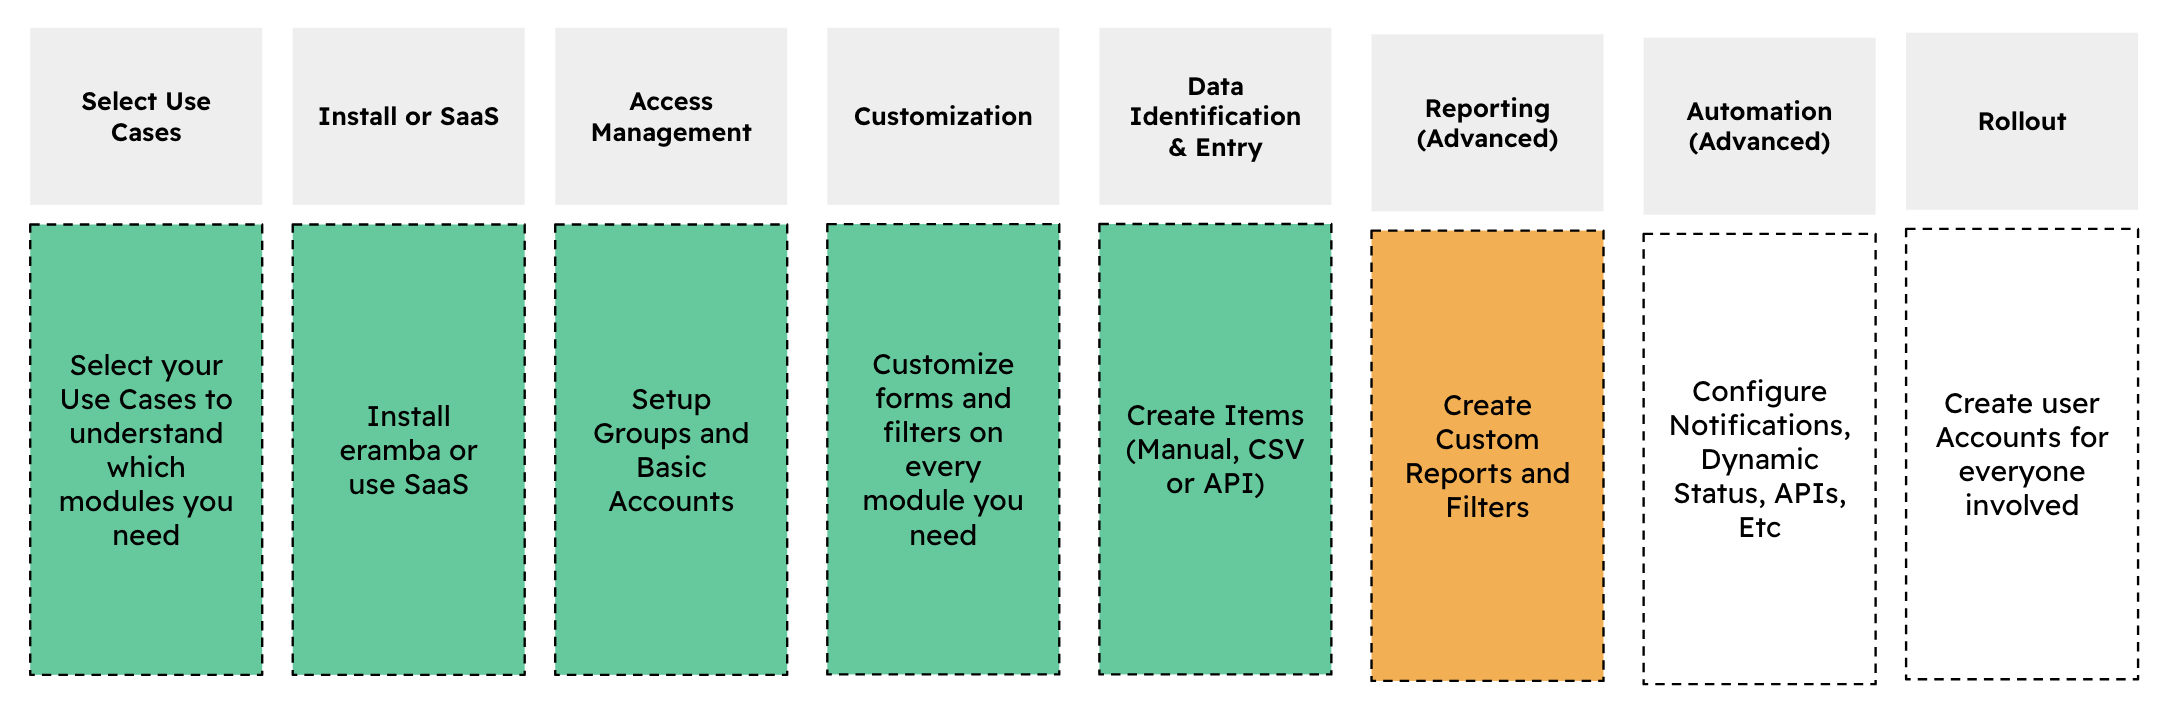
Episode 8
Reporting
In this episode we teach you how reporting works
Introduction
In this phase, you will create filters and graphical reports that can help you visualize data in more detail. These reports can be sent by email to you regularly.
All Use Cases
Required Learning:
- Filters course
- Notifications course
Implementation Tasks:
- Define your Reporting Strategy so you know what filters you need on each module
- Create Custom Filters or re-use existing ones
- Set them as default on your modules, so when you load the module they will be displayed automatically
- Create report notifications to automatically email your filters
If you want to create graphical reports (charts, tables, etc) and also customize your landing dashboard.
Required Learning:
- Graphical Reports course
- Notifications course
Implementation Tasks:
- Define your Reporting Strategy
- Create Custom Reports
- Create Report Notifications
- Adjust landing Dashboard
If you feel that the reports you need are not available in eramba, then you will need to pull data from eramba using CSV exports or REST APIs and build your reporting using BI tools.
Playlist
- Episode 1The Journey2 mins left
- Episode 2Phases2 mins left
- Episode 3Use Cases5 mins left
- Episode 4Installation or SaaS0 mins left
- Episode 5Access Management5 mins left
- Episode 6Customization5 mins left
- Episode 7Data Entry3 mins left
- Episode 8Reporting1 min left
- Episode 9Automation2 mins left
- Episode 10Rollout3 mins left